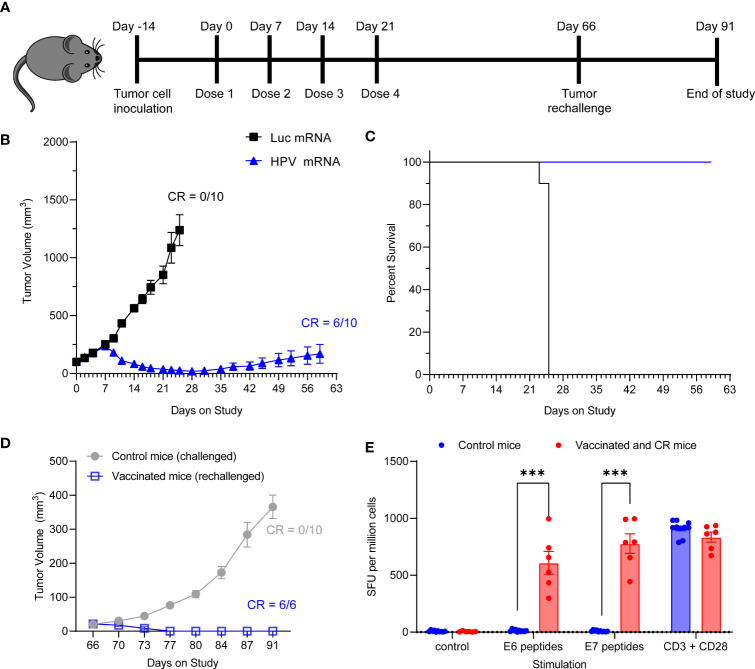
Figure 5.
(A) Schema of tumor study. (B) Tumor growth curve of C3.43 tumor bearing mice vaccinated with four weekly doses of 10 µg HPV vaccine mRNA or Luciferase control mRNA. N=10 mice per group. Data presented as mean ± SEM. CR: complete responders. (C) Survival rates of C3.43 tumor bearing mice vaccinated with four weekly doses of 10 μg HPV vaccine mRNA or Luciferase control mRNA. N=10 mice per group. Data presented as Kaplan-Meier curves. (D) Tumor growth curve of C3.43 challenged (10 control/never vaccinated mice) and C3.43 rechallenged (the 6 mice who received the vaccine and completely responded by day 60) animals. Data presented as mean ± SEM. CR: complete responders. (E) ELISpot analysis of IFNγ positive Spot forming units (SFU) in splenocytes derived from C3.43 tumor bearing- control mice (10 animals, never vaccinated, collected on Day91), -vaccinated and CR mice after rechallenge (6 animals, collected on Day91),and stimulated ex vivo with either a vehicle control, 5 μg/mL HPV16 E7 peptides, 5 μg/mL HPV16 E6 peptides or T-activator CD3/CD28 control. Data presented as mean ± SEM. Differences between groups were tested using two-way ANOVA test (***, P<0.001).

