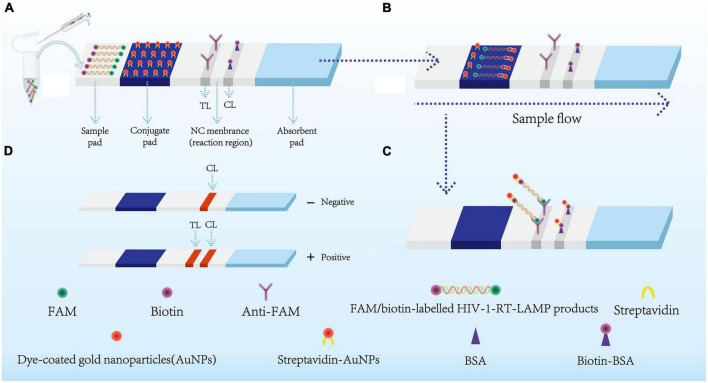
FIGURE 2.
Schematic diagram showing AuNPs-LFA principles for visual HIV-1-RT-LAMP products interpretation. (A) HIV-1-RT-LAMP amplification products (2 μl) and running buffer (100 μl) were added simultaneously on the sample pad. (B) The FAM/biotin-labeled HIV-1-LAMP products flowing to the conjugate pad through capillary forces. Meanwhile, the streptavidin-AuNPs were hydrated and integrated with HIV-1-RT-LAMP products. (C) FAM/biotin-labeled HIV-1-RT-LAMP products were captured with anti-FAM at TL, and streptavidin-AuNPs were captured through biotin-BSA at CL. (D) Interpretation of the HIV-1-RT-LAMP-AuNPs-LFA assay. HIV-1 positive results were indicated by CL and TL bands on the AuNPs-LFA, Negative results were indicated when only the CL band appears on the AuNPs-LFA. HIV-1, human immunodeficiency virus type one; RT-LAMP, reverse transcription loop-mediated isothermal amplification; streptavidin-AuNPs, crimson red dye streptavidin-coated gold nanoparticles. AuNPs-LFA, gold nanoparticles-based lateral flow assay. CL, control line; TL, test line.

