
FIGURE 2.
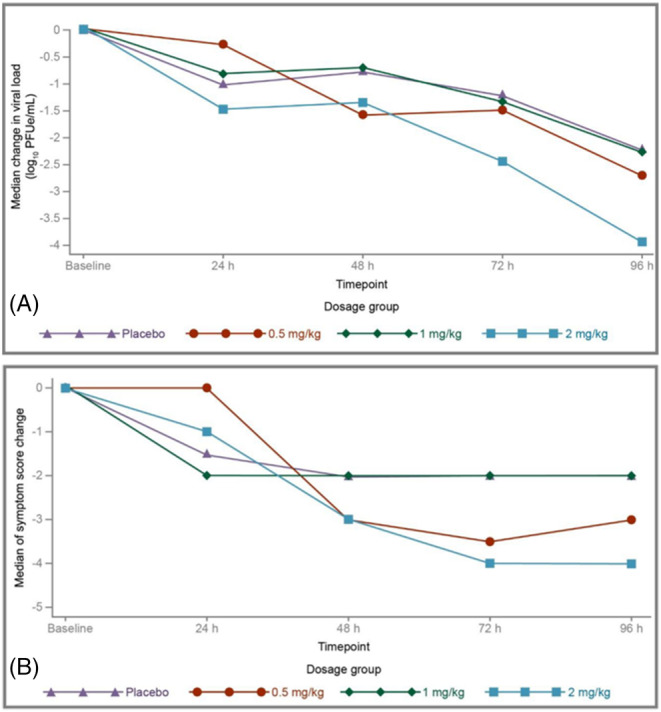
(A) Median change in viral load from baseline to 96 h post‐dose in Part 2 (full analysis population). (B) Median change in Wang respiratory score by dose level in Part 2 (full analysis population). *p < 0.05 for the difference between the 2 mg/kg and placebo groups on Wang respiratory score reduction at 96 h.