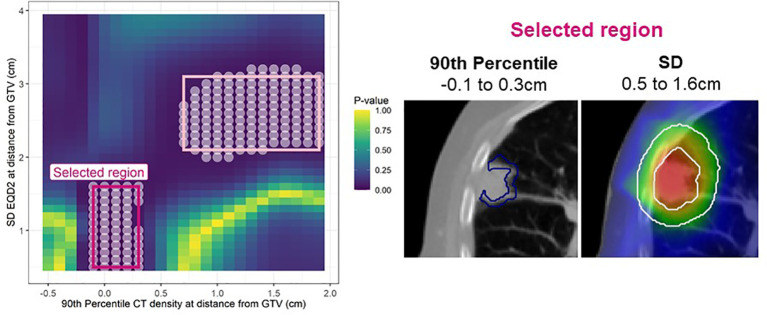
Figure 2.
Left: Cox per radius significance map of interaction between 90th percentile density vs SD EQD2 at distance from the GTV. The p-value reflects a likelihood-ratio test of improvement in model performance due to inclusion of the interaction between dose and density at each location. All significant points are shown with a white circle and the regions extracted for assessment in bootstrap are highlighted in pink. After post-processing only one region remained (bright pink). Right: The annuli volumes defined by the selected regions overlayed on an example patient.

