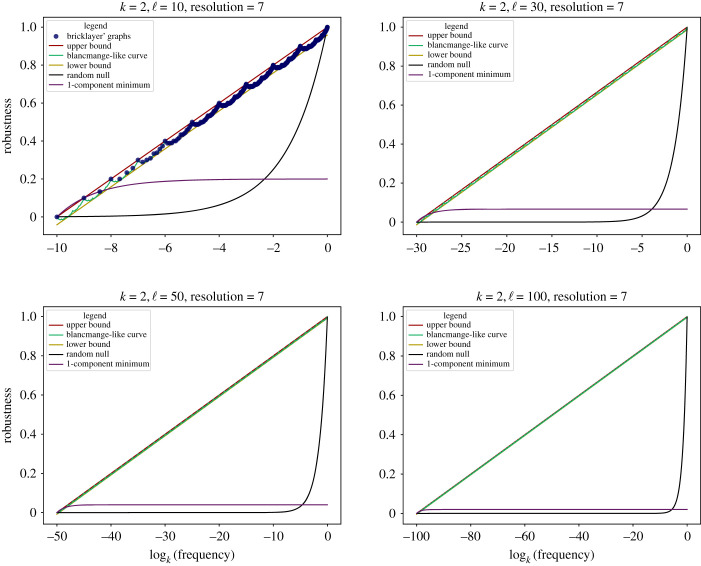
Figure 9.
Plots of the continuous interpolation of the maximum robustness curve (bricklayer’s bound/blancmange-like curve), upper and lower bounds on the maximum robustness, the random null expectation robustness and the single neutral component minimum robustness, generated using RoBound Calculator [52] using k = 2 (corresponding to a binary alphabet, such as in the HP lattice protein model). Plots for ℓ = 10, 30, 50 and 100 are shown. The k = 2, ℓ = 10 plot also shows, as blue dots, the exact robustness of bricklayer’s graphs with an integer number of genotypes/vertices.

