Figure 8.
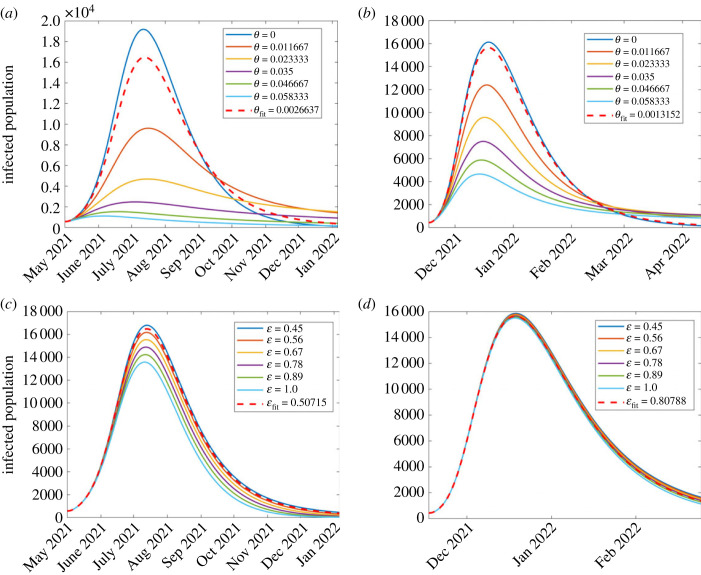
Effect of varying parameter values of θ and which, respectively, represent vaccination rate and vaccination efficacy, on the disease dynamics among infectious population. (a) First wave; (b) second wave; (c) third wave; (d) fourth wave. The figure depicts a reduction in disease incidence with increasing vaccination rates. Both parameters were more influential in the third wave than in the fourth.

