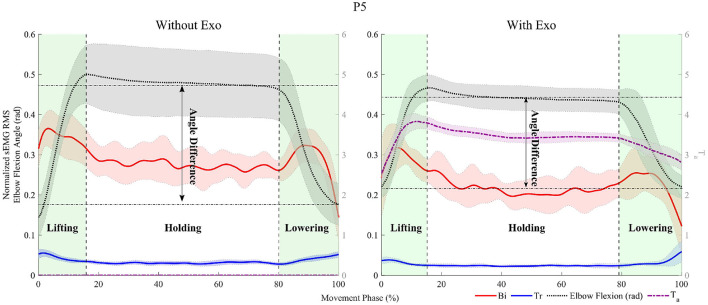
Figure 6.
Representative data for participant, P5, with a 7 kg load. The experimental data are divided into three areas corresponding to the movements, lifting, holding, and lowering. The red, blue, dashed black, and dashed-dot purple lines indicate the moving RMS of the normalized sEMG signal of the Biceps Brachii caput brevis (Bi) and Tricep Brachii caput lateralis (Tr) with 100 samples, the elbow flexion angle (rad), and the assistive torque (Nm), respectively. The angle difference indicates the difference in the elbow flexion angle between the average angle during holding and the angle immediately after placing the box on the table.

