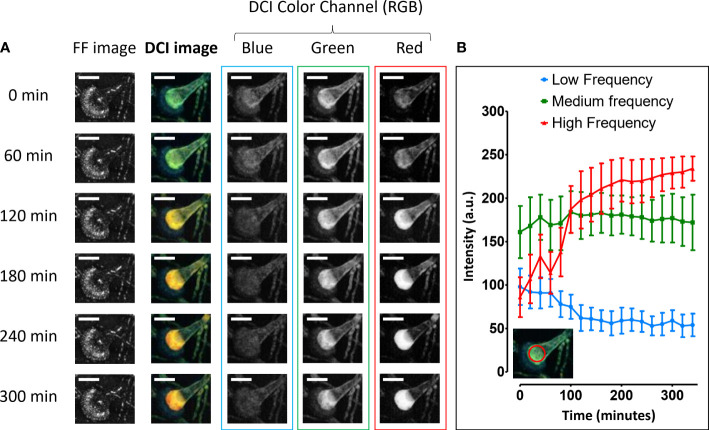
Figure 3.
Whole-volume D-OCT image analysis of Aspergillus fumigatus growth on Sabouraud dextrose agar for 300 min following a 24 h incubation at 30°C in a humidified chamber. The three RGB DCI image color channels are displayed as 50-µm-deep axial Z-projections of a conidial head at different times (0, 60, 120, 180, 240, and 300 min): red for high frequencies/fast movements, green for medium frequencies/intermediate movements, and blue for low frequencies/slow movements (A). The corresponding histogram displays the evolution of each color channel intensity signal within the red circular region of interest located inside the conidial head vesicle for approximately 5 h (B). The scale bar represents 25 µm.

