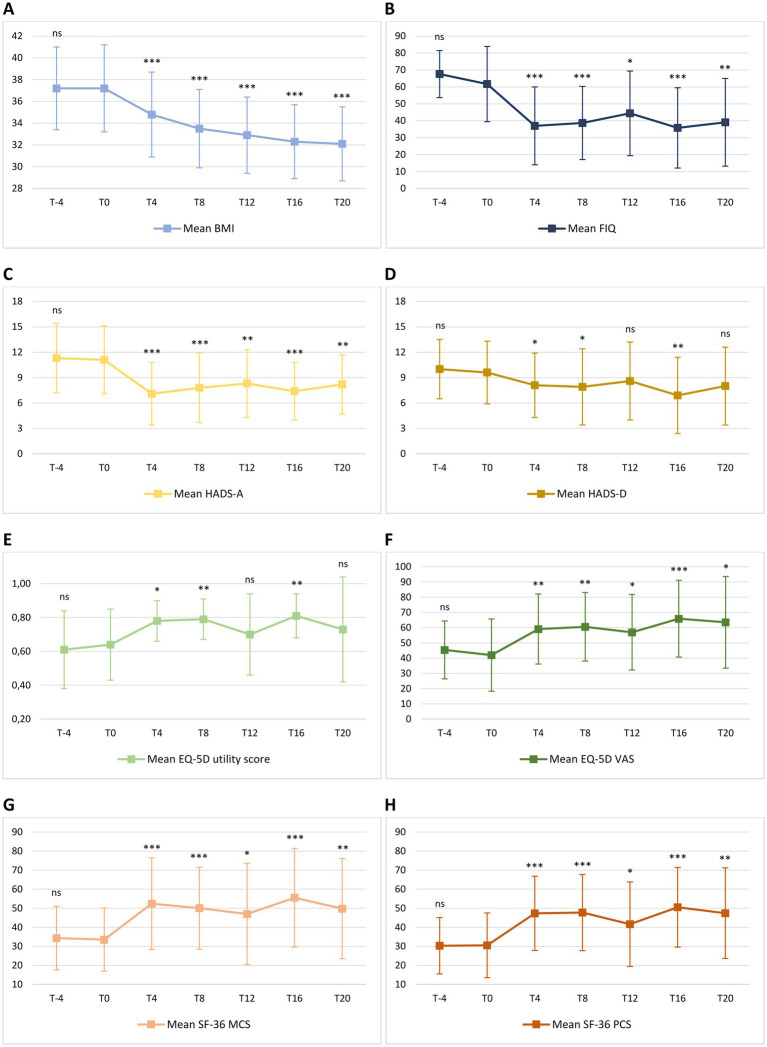
Figure 4.
Mean change in body mass index [BMI – (A)], Fibromyalgia Impact Questionnaire [FIQ – (B)], Hospital Anxiety and Depression Scale [HADS – (C,D)], EuroQol 5D [EQ-5D – (E,F)] and 36-item Short Form Health Survey [SF-36 – (G,H)] from T-4 to T20. Level of significance of each measurement compared with T0 is indicated on the plots: ns = non-significant; * = <0.05; ** = <0.01; *** <0.001. (A) Mean BMI was 37.2 ± 3.8 at T-4 and 37.2 ± 4.0 at T0 (p = 0.995). During the ketogenic phase, mean BMI significantly decreased to 34.8 ± 3.9 at T4 (p < 0.001) and to 33.5 ± 3.6 at T8 (p < 0.001). Compared with FIGURE 4 (Continued)baseline values, the decrease in mean BMI was also significant during the carbohydrate reintroduction period, with 32.9 ± 3.5 at T12 (p < 0.001), 32.3 ± 3.4 at T16 (p < 0.001) and 32.1 ± 3.4 at T20 (p < 0.001). (B) Mean FIQ was 67.6 ± 13.9 at T-4 and 61.7 ± 22.2 at T0 (p = 0.124). Compared to T0, mean FIQ improved during the ketogenic period to 37.0 ± 23.0 at T4 (p < 0.001) and to 38.7 ± 21.6 at T8 (p < 0.001), with significant changes to 44.4 ± 25.0 observed also at T12 (p = 0.012), to 35.8 ± 23.7 at T16 (p < 0.001) and to 39.1 ± 25.9 at T20 (p = 0.002). (C) Mean HADS-A was 11.3 ± 4.1 at T-4 and 11.1 ± 4.0 at T0 (p = 0.633). Compared to T0, HADS-A significantly improved to 7.1 ± 3.7 at T4 (p < 0.001) and to 7.8 ± 4.1 at T8 (p < 0.001). Furthermore, HADS-A decreased to 8.3 ± 4.0 at T12 (p = 0.001), to 7.4 ± 3.4 at T16 (p < 0.001) and to 8.2 ± 3.5 at T20 (p = 0.004). (D) Mean HADS-D was 10.0 ± 3.5 at T-4 and 9.6 ± 3.7 at T0 (p = 0.571). Compared to T0, mean HADS-D significantly improved to 8.1 ± 3.8 at T4 (p = 0.021), to 7.9 ± 4.5 at T8 (p = 0.030) and to 6.9 ± 4.5 at T16 (p = 0.005). At T12 and T20, a non-significant reduction, respectively, to 8.6 ± 4.6 (p = 0.219) and to 8.0 ± 4.6 (p = 0.116) was observed. (E) Mean EQ-5D utility score was 0.61 ± 0.23 at T-4 and 0.64 ± 0.21 at T0 (p = 0.469). Compared to T0, mean EQ-5D utility score significantly increased to 0.78 ± 0.12 at T4 (p = 0.010), to 0.79 ± 0.12 at T8 (p = 0.003) and to 0.81 ± 0.13 at T16 (p = 0.002), while there was no significant difference between the baseline score and the values of 0.70 ± 0.24 (p = 0.333) and 0.73 ± 0.31 (p = 0.295) observed, respectively, at T12 and at T20. (F) Mean EQ-5D VAS score was 45.4 ± 19.0 at T-4 and 42.0 ± 23.7 at T0 (p = 0.297). Compared to T0, mean EQ-5D VAS score significantly improved to 59.1 ± 23.0 at T4 (p = 0.002), to 60.6 ± 22.5 at T8 (p = 0.009), to 57.0 ± 24.8 at T12 (p = 0.038), to 65.9 ± 25.2 at T16 (p < 0.001) and to 63.5 ± 30.1 at T20 (p = 0.022). (G) Mean SF-36 MCS was 34.3 ± 16.7 at T-4 and 33.5 ± 16.6 at T0 (p = 0.849). Compared to T0, mean SF-36 MCS significantly increased to 52.4 ± 24.0 at T4 (p < 0.001), to 50.1 ± 21.5 at T8 (p < 0.001), to 47.0 ± 26.6 at T12 (p = 0.010), to 55.5 ± 25.9 at T16 (p < 0.001) and to 49.8 ± 26.3 at T20 (p = 0.002). (H) Mean SF-36 PCS was 30.3 ± 14.8 at T-4 and 30.5 ± 17.0 at T0 (p = 0.942). Compared to T0, mean SF-36 PCS significantly increased to 47.3 ± 19.5 at T4 (p < 0.001), to 47.7 ± 20.0 at T8 (p < 0.001), to 41.6 ± 22.2 at T12 (p = 0.015), to 50.5 ± 20.9 at T16 (p < 0.001) and to 47.4 ± 23.8 at T20 (p = 0.009).

