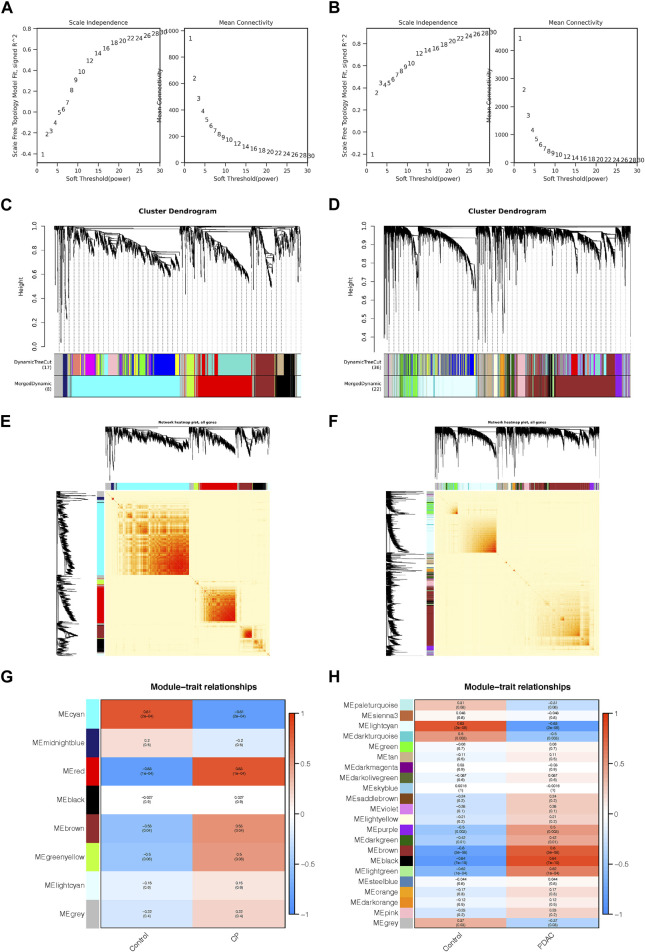
FIGURE 1.
Co-expression networks constructed for CP and PDAC datasets. (A, B) Network topology analysis of different adjacency matrix weight parameter power. As shown on the left, the power affected the scale-free topology fit index. And in the right diagram, the power affected mean connectivity. (C, D) Genome dendrograms obtained by hierarchical clustering using mean linkage. Below the dendrogram were colored rows showing the allocation of modules determined by Dynamic Tree Cutting. (E, F) All genes were shown as a heat map plot with their topological overlap matrix (TOM). Red indicated higher overlap, while light indicated low overlap. Gene dendrograms and module assignments were shown on the left side and top side, respectively. (G, H) Heap of module-trait relationships in CP (G) and PDAC (H). CP, chronic pancreatitis; PDAC, pancreatic ductal adenocarcinoma.

