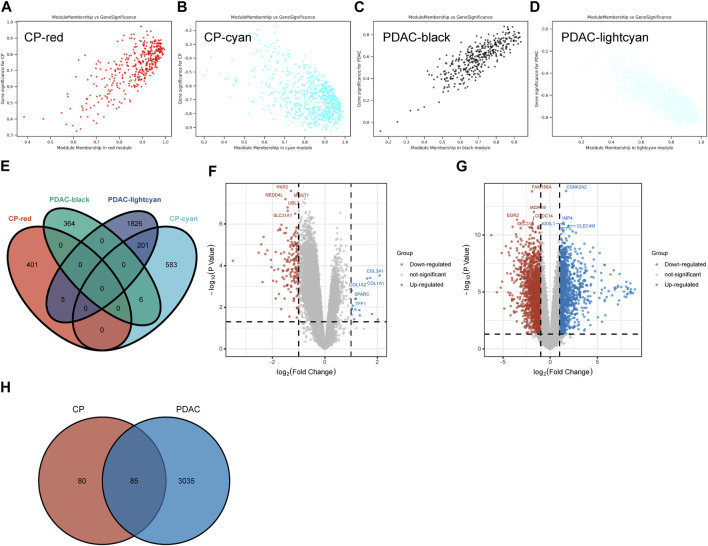
FIGURE 2.
The Shared Genes in CP and PDAC. (A–D) Scattered plots were generated from the results of GS and MM. MM values in the module correspond to the abscissa, GS values for each gene in the trait correspond to the ordinate, and each point in the picture corresponds to one gene in the module. (E) Venn diagram of the shared genes between the two CP modules and two PDAC modules. (F) Volcano map of GSE143754. (G) Volcano map of GSE91035. Upregulated genes were marked in blue; downregulated genes were marked in red. The figure shows two vertical dashed lines, representing log2 (FC) at −1 and 1; Horizontally dashed line represents adjusted p-value at 0.05. (H) Venn diagram of DEGs in GSE143754 and GSE91035 gene chips. GS, Gene Significance; MM, Module Membership; DEGs, differentially expressed genes.

