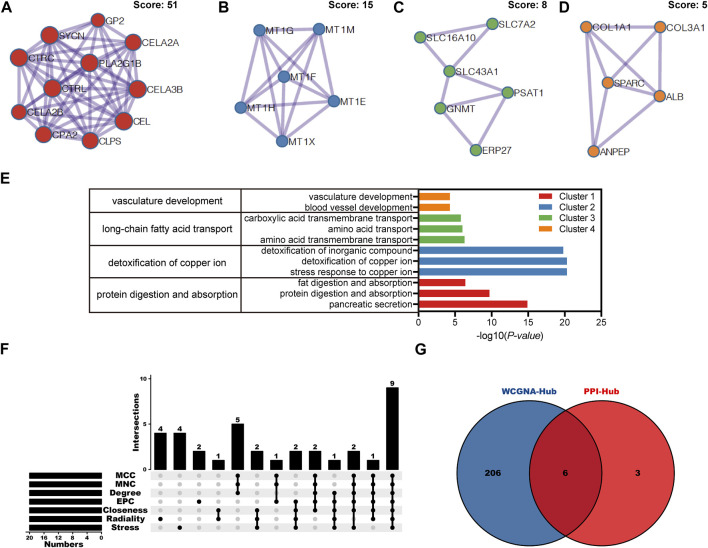
FIGURE 4.
PPI network, module analysis, and hub gene identification. (A–D) Four module analyses constructed from the PPI network. (E) GO biological process of the four clusters. (F) Upset diagram identified nine most critical genes that were shared by seven feature selection algorithms. (G) Venn diagram presented real hub genes under WCGNA co-expression and those involved in the PPI network. PPI, Protein-protein interactions; GO, gene ontology.

