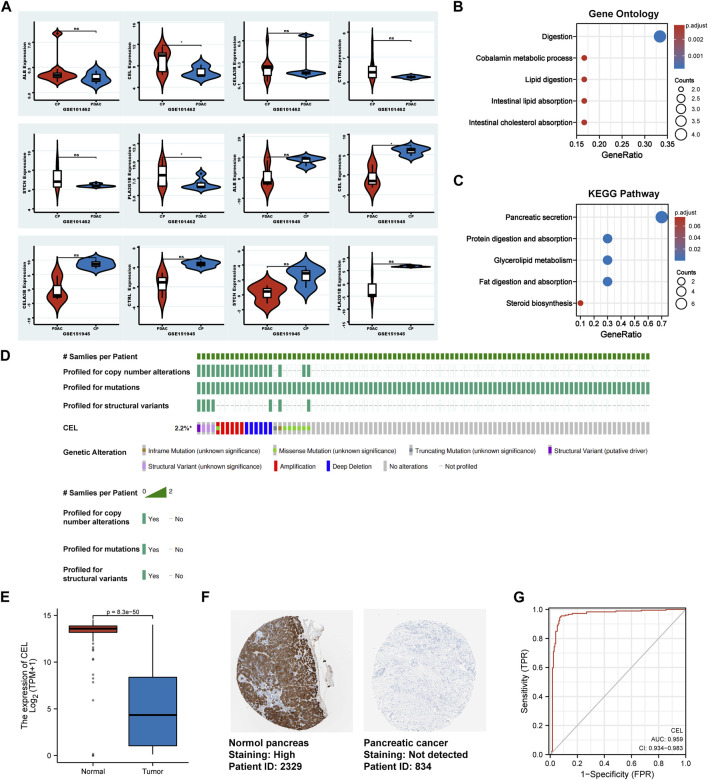
FIGURE 5.
Identification of the real hub DEGs. (A) Boxplots of the expression of real hub genes in validation sets. (B, C) The DEGs from validation sets were employed for GO and KEGG analysis, respectively. (D) The mutation information for CEL gene in cBioPortal. (E) Boxplots showed the mRNA expression level of CEL. Red represents normal, blue represents tumor. (F) The CEL protein expression level in the HPA database. (G) ROC curve of CEL relative expression for diagnosis of PDAC. The abscissa was the false positive rate, and the ordinate was the true positive rate. DEGs, differentially expressed genes; GO, Gene Ontology; KEGG, Kyoto Encyclopedia of Genes and Genomes; HPA, Human Protein Atlas; PDAC, pancreatic ductal adenocarcinoma.

