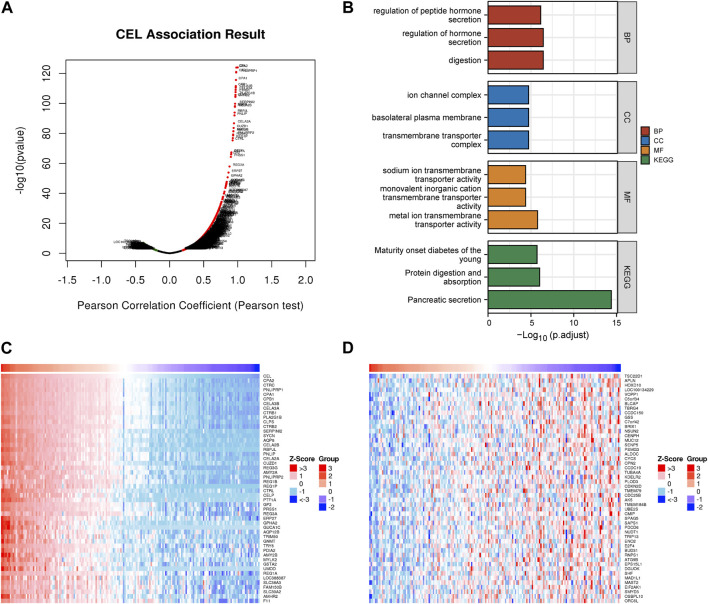
FIGURE 6.
Co-expression gene networks and enrichment analyses of CEL genes. (A) Co-expression genes of CEL were analyzed by Pearson test based on LinkedOmics database. (B) GO and KEGG analysis of CEL-related co-expression genes in PDAC. (C) The top 50 genes with a positive correlation with CEL were visualized in a heatmap. (D) The top 50 genes with a negative correlation with CEL were visualized in a heatmap. GO, Gene Ontology; KEGG, Kyoto Encyclopedia of Genes and Genomes; PDAC, pancreatic ductal adenocarcinoma.

