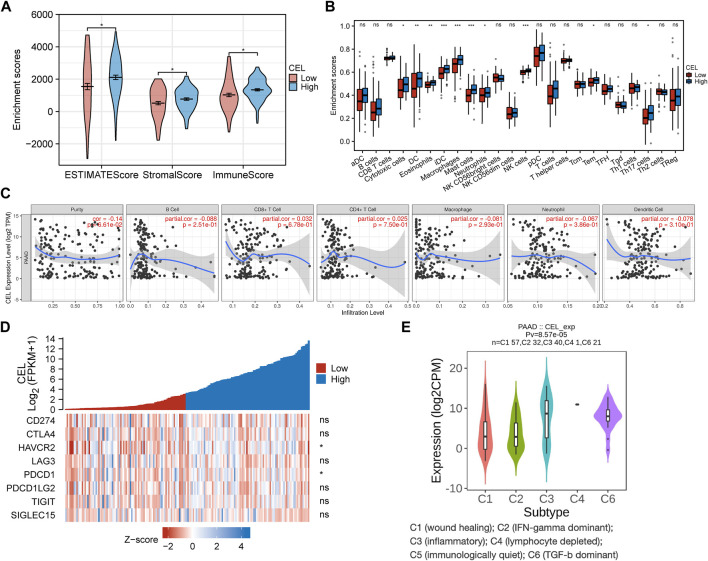
FIGURE 8.
Immune analysis of CEL in PDAC. (A) Comparing CEL-high and CEL-low groups based on ESTIMATE scores, stromal scores, and Immune scores. (B) Comparison of immune cell subsets between CEL-low and CEL-high groups. (C) CEL expression is correlated with immune infiltration in PDAC as analyzed using the TIMER database. (D) Heatmap of 8 immune checkpoints between CEL-low and CEL-high groups. (E) CEL expression in different immune subtypes of PDAC. C1, wound healing; C2, IFN-gamma dominant; C3, inflammatory; C4, lymphocyte depleted; C5, immunologically quiet; C6, TGF-b dominant. PDAC, pancreatic ductal adenocarcinoma; ns, no significance. ∗p < 0.05; ∗∗p < 0.01; and ∗∗∗p < 0.001.

