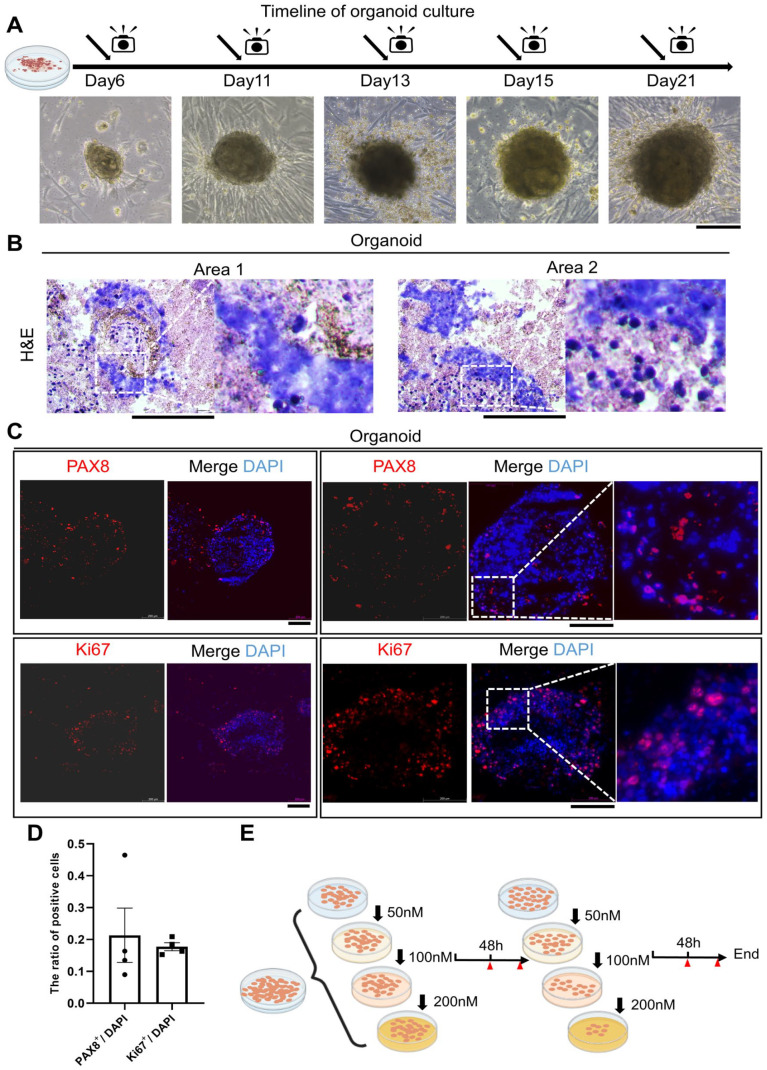
Figure 2.
Detection of patient-derived OC organoids. (A) Bright view pictures of patient-derived ovarian organoids at different time points; (B) Representative H&E staining of OC organoids. (C) immunofluorescence results of PAX8 and Ki67 were shown. The expression level was showed by merged images. Scale bars: 200 μm. (D) Bar graphs describe the ratio of ovarian cancer marker positive cells to DAPI-stained cells in OC organoids. Dots represent individual data points. Quantitative analysis was presented as the mean ± SEM. (E) Schematic diagram of drug sensitivity assay processing.

