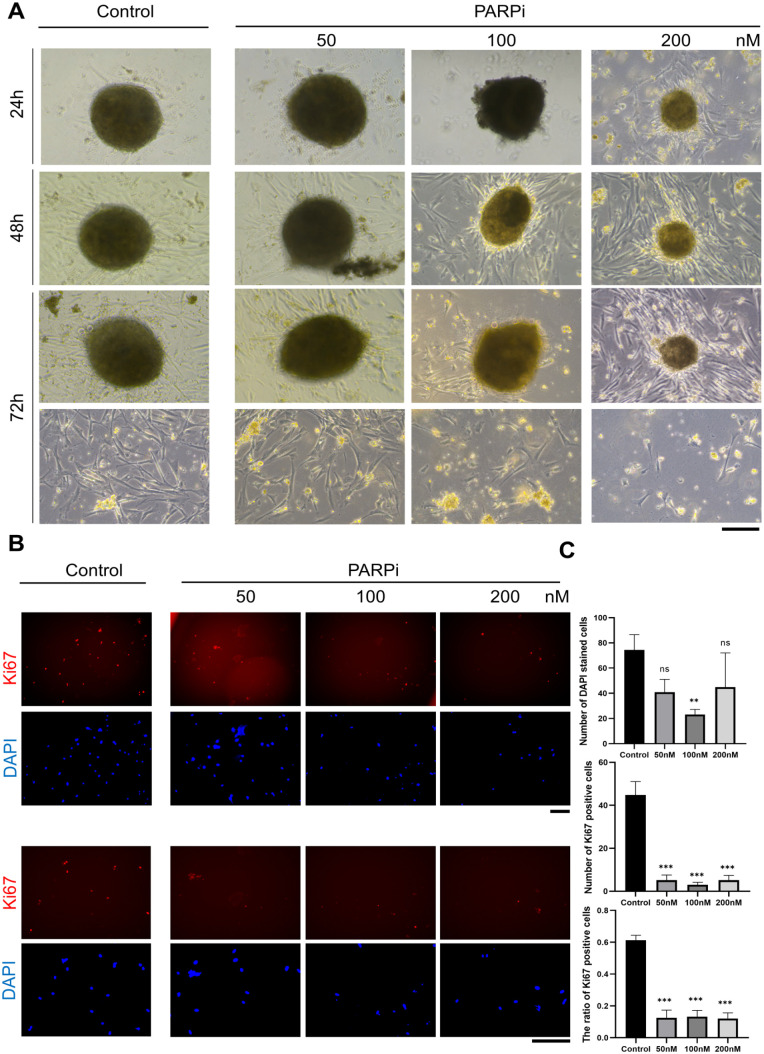
Figure 3.
Morphological changes of organoids after PARPi treatment. (A) Representative bright field images of organoids after PARPi treatment were shown. The patient-derived organoids were inhibited by high-concentration PARPi, and treating for a long time did not represent a significant difference. Scale bars, 200 μm. (B) Representative images of Ki67 and DAPI immunofluorescence staining of adherent cells. Three indicated groups were divided to investigate dose sensitivity. (C) The expression level of ovarian cancer marker Ki67 and proportion of Ki67/DAPI in adherent cells after PARPi treatment was measured. Data are presented as the mean ± SEM (n = 3; *P < 0.05; **P < 0.01; ***P < 0.001; student’s test).

