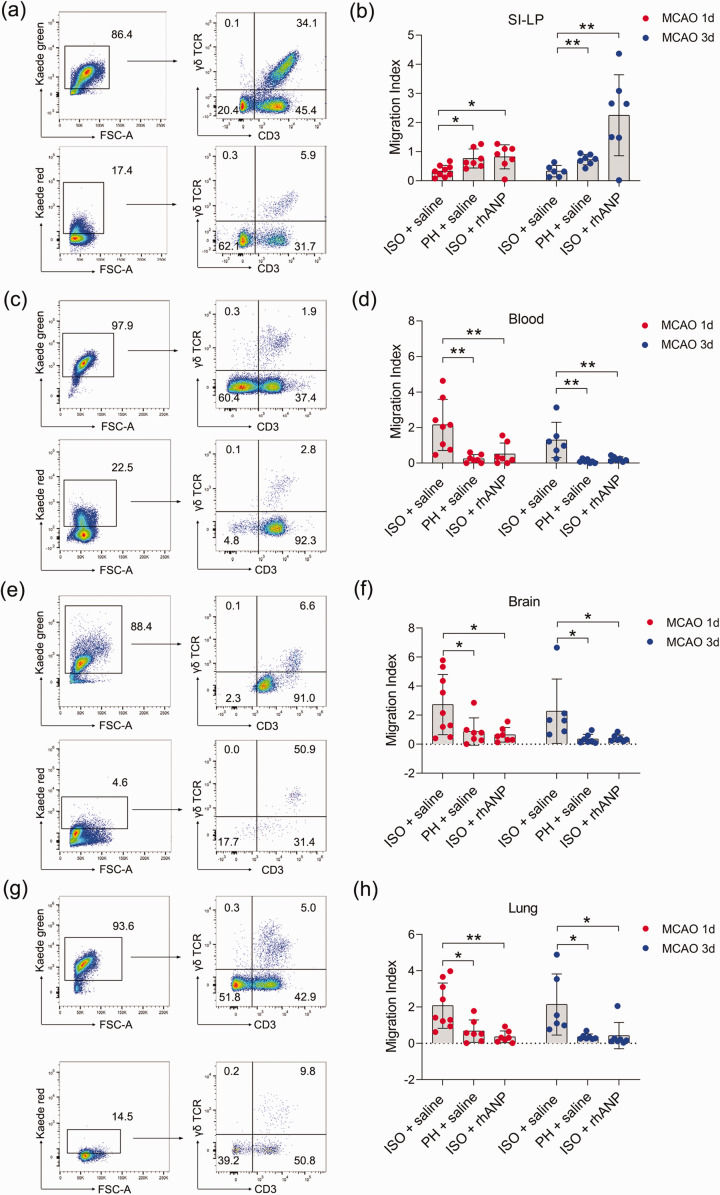
Figure 4.
Tracking γδ T-cell migration from the small intestine to peripheral organs in Kaede-Tg mice after stroke. Representative flow cytometric plot of migratory γδ T cells of the SI-LP (a), blood (c), brain (e) and lung (g). Graph showing the extent of migration of photoconverted γδ T cells from the SI-LP (b) to blood (d), brain (f) and lung (h). The migration index was calculated as Kaede Red+ CD3+ γδ TCR+/Kaede Green+ CD3+ γδ TCR+, and represented the migration of γδ T cells to other sites. Data are presented as individual values plus means ± SDs (n = 6–9/group). Comparisons were determined by one-way ANOVA followed by post hoc Newman–Keuls multiple comparison tests. *P < 0.05, **P < 0.01. ISO, isolated housing; MCAO, middle cerebral artery occlusion; PH, pair housing; rhANP, recombinant human atrial natriuretic peptide; SI-LP, lamina propria of small intestine.

