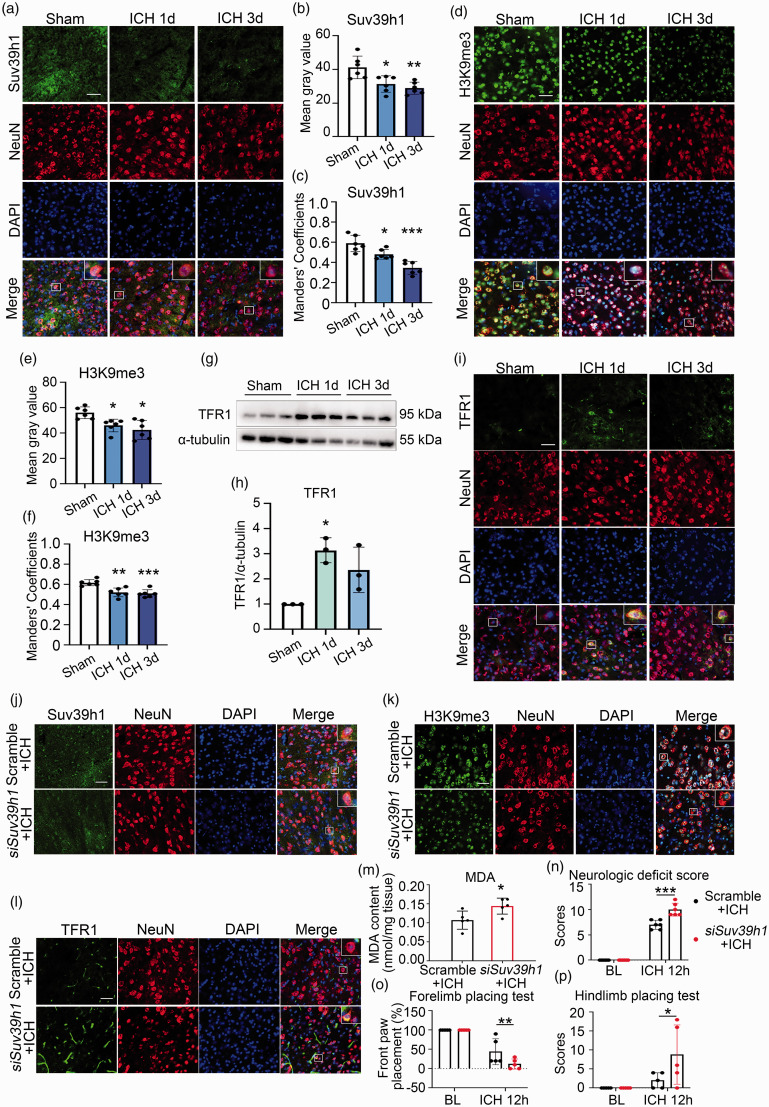
Figure 6.
Suv39h1-mediated H3K9me3 regulated ferroptosis after ICH. (a–f) Brain slices obtained at day 1 and 3 post ICH were stained with Suv39h1, H3K9me3, NeuN antibody and DAPI (a, d). The mean fluorescence intensity of Suv39h1 and H3K9me3 were quantified respectively (b, e). The Manders' Colocalization Coefficients (M1) were calculated (c, f). (g, h) The protein of TFR1 was detected from ipsilateral striatum using Western blot (g) and quantified (h). (i) Immunostaining was performed using TFR1 antibody at 1 day and 3 days post ICH. (j–l) Immunostaining was performed using Suv39h1 (j), H3K9me3 (k) or TFR1 antibody (l) at day 3 post ICH. (m) MDA content was measured at day 3 after ICH. (n–p) Neurological function was assessed at 12 h post ICH. Results are shown as scatter plots (Mean ± SD). n = 6 images from 3 mice (b, c, e, f). n = 3 mice (h). n = 5–6 mice (m–p). One-way ANOVA (b, c, f, h, n–p) or Kruskal-Wallis test (e) followed by Tukey's or Dunn’s multiple comparisons tests, respectively or two-tailed t test (m) was used. *p < 0.05, **p < 0.01, ***p < 0.001 vs Sham or Scramble or baseline (BL) group. Scale bar: (a, d, i, j, k, l) 75 μm.

