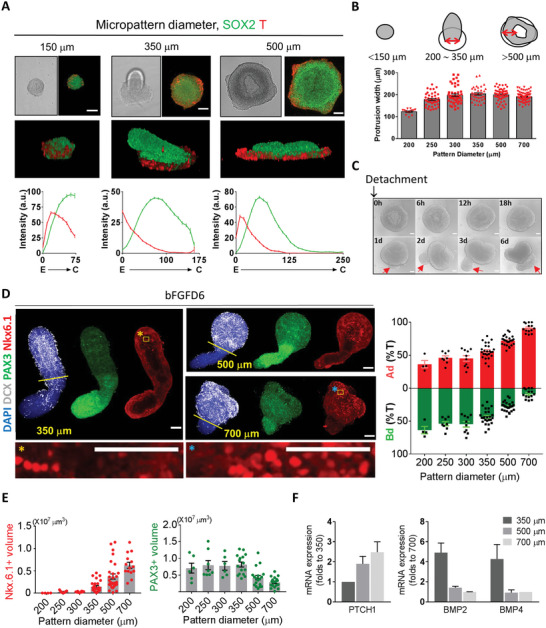
Figure 6.

Control of dorsal/ventral proportion in pSCOs by the 2D colony size on micropattern. A) Effects of micropatterned colony size on spatial cell patterning and colony morphogenesis. Immunofluorescence analysis and quantification of colonies grown on micropatterns with the indicated diameters at day 3 with SB/Chir treatment. Quantification of fluorescent intensities at each position shown as mean ± SEM (n = total 4795 data points from 15 images at 150 µm, total 15 489 data points from 11 images at 350 µm, total 18 441 data points from six images at 500 µm). B) Quantification of protrusion width at SCD3. The width measured at the top of each colony was indicated by double‐headed red arrows. Protrusion width shown as mean ± SEM. C) Growth of 3D structures derived from a 500‐µm colony after detachment from 2D micropattern in the presence of bFGF for 6 days. Red arrows indicate the extension newly generated from the Bd part. D) Effect of micropatterned colony size on the proportion of Ad/Bd domains of organoids at bFGFD6 and quantification. Ad domain was specified with DCX‐positive cells. High‐magnification images correspond to inset. Quantification of Ad and Bd proportions at each colony size shown as mean ± SEM. E) Quantification of dorsal and ventral domains of organoids depending on the initial 2D micropattern size. Volumes shown as mean ± SEM. F) mRNA levels of PTCH1 and BMPs of pSCOs (FGFD6 and FGFD4, respectively) derived from different sizes of micropatterned colonies. Relative expression level of genes shown as fold changes to 350 or 700 µm colonies (n = 3 per group). Confocal images were taken in 1‐ or 5‐µm steps along the z‐axis after fixation and immunostaining with the indicated antibodies and stacked using Z‐stack maximum projection. All images are representative examples from at least three independent experiments. Scale bar, 100 µm.
