
Figure 1.
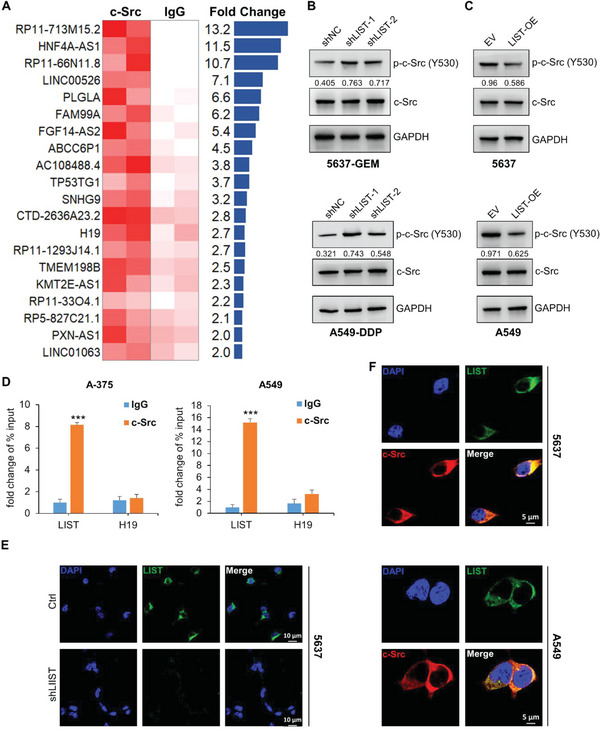
Identification of lncRNAs that bind and regulate c‐Src phosphorylation. A) Expression profiles of lncRNAs pulled down by c‐Src RIP in cell line 5637; IgG‐RIP was used as a negative control. The lncRNAs (fold‐change ≥ 2) are included in the table. Experiments were performed using two biological replicates. B,C) The total protein and phosphorylation levels of c‐Src were detected by western blotting upon LIST knockdown or overexpression. The proteins were quantified by Image J software. The numbers represent the ratio of p‐c‐Src‐Y530/c‐Src. D) LIST expression was measured via c‐Src RIP‐qPCR in A‐375 and A‐549 cancer cells. H19 was used as the negative control. The error bars represent the standard deviation of three replicates (***p < 0.001), Student's t‐test. E) The subcellular localization of LIST (green) was examined via RNA FISH assay in cell line 5637 under control and LIST knockdown conditions. DAPI (blue) represents nuclei. Scale bar: 10µm. F) Colocalization immunofluorescence staining of LIST (green) and c‐Src (red) in 5637 and A‐549 cancer cells. Nuclei were stained with DAPI (blue). Scale bar: 5µm.