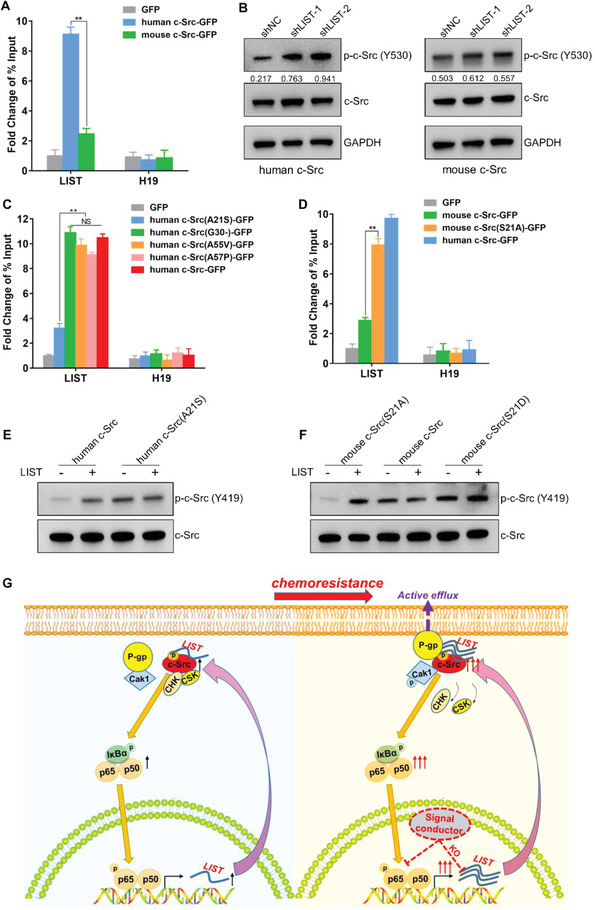
Figure 9.

Differences between human and mouse c‐Src in the interactions with LIST. A) GFP‐tagged human or mouse c‐Src was re‐expressed into c‐Src−/−cell line 5637‐CEM. Enrichment of LIST was detected using GFP‐RIP‐qPCR. H19 was used as a negative control. The error bars represent the SD of three replicates (**p < 0.01), Student's t‐test. B) Mouse or human c‐Src was re‐expressed into c‐Src−/−cell line 5637‐CEM. The total protein and phosphorylation levels of c‐Src were detected by western blotting upon LIST knockdown. The proteins were quantified by Image J software. The numbers represent the ratio of p‐c‐Src‐Y530/c‐Src. C) GFP‐tagged wild‐type or mutant human c‐Src at the four residues individually was reintroduced into c‐Src−/−cell line 5637‐CEM. Enrichment of LIST was detected using GFP‐RIP‐qPCR. H19 was used as a negative control. The error bars represent the ± SD of three biological replicates (NS represents not significant, **p < 0.01), Student's t‐test. D) GFP‐tagged wild‐type human c‐Src, mouse c‐Src, or mutant mouse c‐Src at the 21 residues (Ser to Ala) was reintroduced into c‐Src−/−cell line 5637‐CEM. Enrichment of LIST was detected using GFP‐RIP‐qPCR. H19 was used as a negative control. The error bars represent the ± SD of three biological replicates (**p < 0.01), Student's t‐test. E) In vitro phosphorylation assay for purified wild‐type or mutant human c‐Src, which was incubated with LIST for 1 h. The phosphorylation state was determined using anti‐c‐Src (phospho Y419), which represents c‐Src activity. F) In vitro phosphorylation assay for purified wild‐type or mutant mouse c‐Src (S21A mimics non‐phosphorylation; S21D mimics phosphorylation), which was incubated with LIST for 1 h. The phosphorylation state was determined using anti‐c‐Src (phospho Y419), which represents c‐Src activity. G) Schematic diagram of c‐Src/LIST positive feedback loop regulating tumor progression and chemoresistance.
