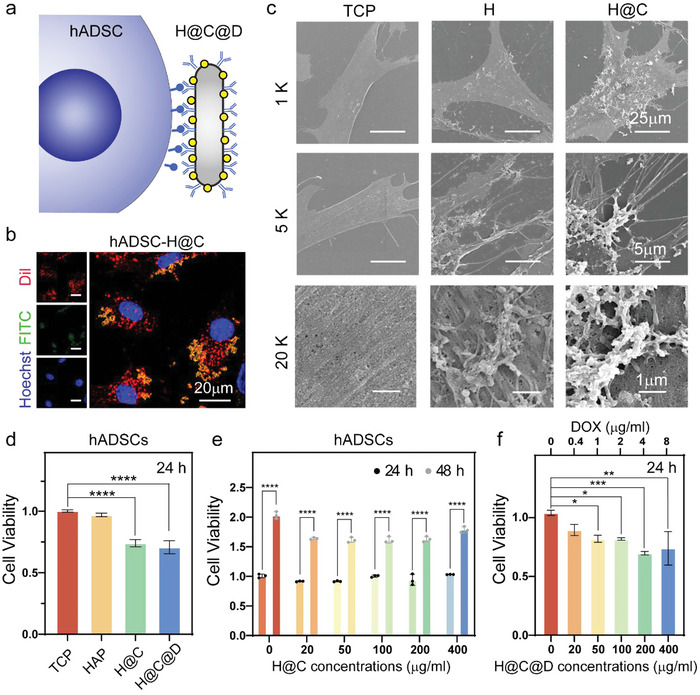
Figure 2.

Construction and biocompatibility of the living material. a) Scheme of the living materials constructed with hADSCs and H@C@D. b) Bioconjugation of 100 µg mL−1 H@C on the hADSC membrane after 30 min. Red, green and blue channels show Dil‐stained cell membranes, FITC‐labeled H@C, and Hoechst‐stained nuclei, respectively. c) SEM images of hADSCs cultured with 100 µg mL−1 nHAP and H@C for 2 h. d) CCK‐8 assay of hADSCs cultured with 100 µg mL−1 nHAP, H@C, and H@C@D for 24 h. Data are presented as the mean ± SD. The p values were calculated using one‐way ANOVA with Bonferroni's comparison test (n = 3; *p < 0.05, **p < 0.01, ***p < 0.001, and ****p < 0.0001). e) CCK‐8 assay of hADSCs cultured with different concentrations of H@C for 24 and 48 h. Data are presented as the mean ± SD. The p values were calculated using two‐way ANOVA with Bonferroni's comparison test (n = 3; *p < 0.05, **p < 0.01, ***p < 0.001, and ****p < 0.0001). f) CCK‐8 assay of hADSCs cultured with different concentrations of H@C@D for 24 h. Data are presented as the mean ± SD. The p values were calculated using one‐way ANOVA with Bonferroni's comparison test (n = 3; *p < 0.05, **p < 0.01, ***p < 0.001, and ****p < 0.0001).
