Figure 5.

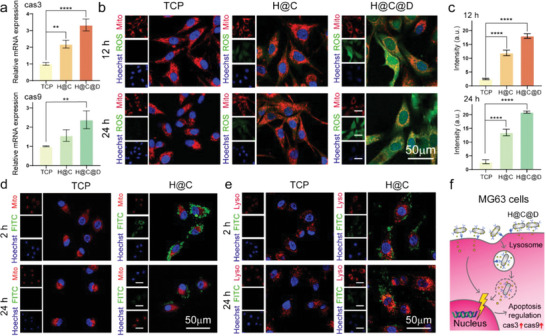
The antitumor effect and process of the proposed living materials in vitro. a) qRT–PCR analysis of apoptosis‐related genes in MG63 cells. Data are presented as the mean ± SD. The p values were calculated using one‐way ANOVA with Bonferroni's comparison test (n = 3; *p < 0.05, **p < 0.01, ***p < 0.001, and ****p < 0.0001). b,c) Mito/ROS staining of MG63 cells and the statistical analysis of the mean ROS fluorescence intensity in the cells. The red, green, and blue colors represent the mitochondria, ROS, and Hoechst‐stained nuclei, respectively. Data are presented as the mean ± SD. The p values were calculated using one‐way ANOVA with Bonferroni's comparison test (n = 3; *p < 0.05, **p < 0.01, ***p < 0.001, and ****p < 0.0001). d) Colocalization of FITC‐labeled H@C nanorods and mitochondria in MG63 cells after 2 and 24 h of culture. The red, green, and blue colors represent mitochondria, FITC‐labeled H@C nanorods, and Hoechst‐stained nuclei, respectively. e) Colocalization of FITC‐labeled H@C nanorods and lysosomes in MG63 cells after 2 and 24 h of culture. The red, green, and blue colors represent lysosomes, FITC‐labeled H@C nanorods, and Hoechst‐stained nuclei, respectively. f) Scheme of the mechanism by which H@C@D nanorods regulate the apoptosis of MG63 cells.
