
Figure 6.
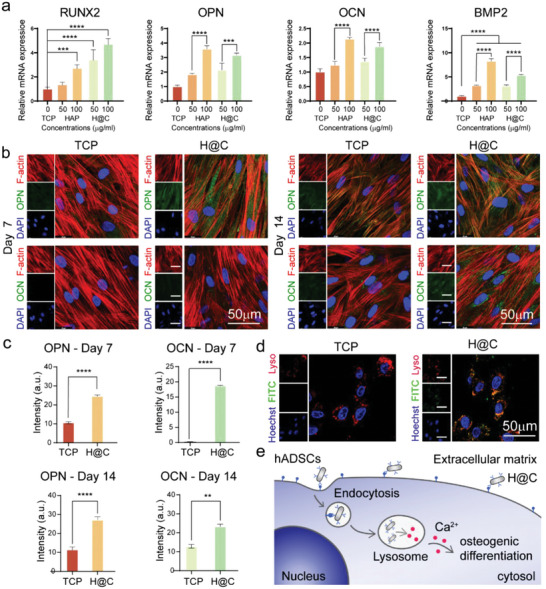
Osteogenic differentiation of hADSCs treated with H@C nanorods. a) qRT–PCR analysis of osteogenesis‐related gene expression after culture with various concentrations of HAP nanorods and H@C nanorods for 7 days. The p values were calculated using one‐way ANOVA with Bonferroni's comparison test (n = 3; *p < 0.05, **p < 0.01, ***p < 0.001, and ****p < 0.0001). b) Immunofluorescence staining of osteogenic markers after culture with 100 µg mL−1 H@C nanorods for 7 and 14 days. c) Mean fluorescence intensity after culture of MG63 cells with 100 µg mL−1 H@C nanorods for 7 and 14 days. The p values were calculated using one‐way ANOVA with Bonferroni's comparison test (n = 3; *p < 0.05, **p < 0.01, ***p < 0.001, and ****p < 0.0001). d) Colocalization of FITC‐labeled H@C nanorods and lysosomes in hADSCs after culture for 24 h. The red, green, and blue colors indicate LysoTracker‐stained lysosomes, FITC‐labeled H@C (concentration = 100 µg mL−1), and Hoechst‐stained nuclei, respectively. e) Scheme of the mechanism by which H@C nanorods regulate the fate of hADSCs.