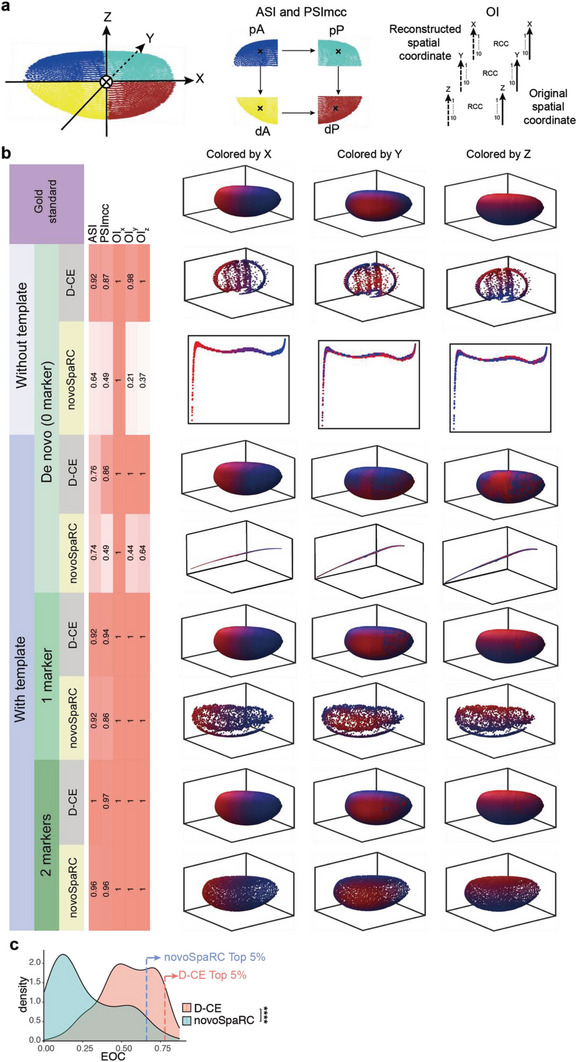
Figure 3.

Comparison of spatial reconstruction of BDTNP dataset using D‐CE and novoSpaRC. a) Illustration of Drosophila embryo segmentation for ASI and PSImcc and the OI x , OI y , and OI z calculation. The embryo was divided into 4 groups along the x and z coordinates (a, middle) by spatial locations for ASI and PSImcc calculation. Each coordinate was sorted and divided into 10 groups (a, right) and OI was calculated based on the gold standard original spatial coordinate. b, Original spatial positions (row 1) in Drosophila embryo examined by the BDTNP dataset, which is colored by spatial coordinates on x (left), y (middle), and z‐axis,[ 42 ] respectively. Reference coordinates of x, y, and z axis are labeled in ascending order with a color gradient from blue to red, which is also used to paint the samples in the reconstructed structures to visualize their 3D orders in the following panels. D‐CE and novoSpaRC spatial reconstruction of BDTNP (row 2 and 3). D‐CE‐t and NovoSpaRC spatial reconstruction of BDTNP dataset with 0 marker (row 4 and 5), 1 marker (row 6 and 7) and 2 markers (row 8 and 9) visualized by sample color code designated by the gold standards (top panel) for X, Y, and Z axis, respectively. Indexes of spatial reconstruction evaluation are shown as a column scaled heatmap next to each reconstructed embryo. NovoSpaRC randomly selects 1 or 2 markers for marker‐based template fitting, the best result among 100 trials is used for novoSpaRC. c, Density plot of all expressed genes to the D‐CE and novoSpaRC reconstructions’ coordinates. The dashed line indicates the EOC position of top 5% genes in each distribution. Student's t‐test was used to compare the distribution difference between D‐CE and the other two methods. ****p‐value < 2.2e‐16.
