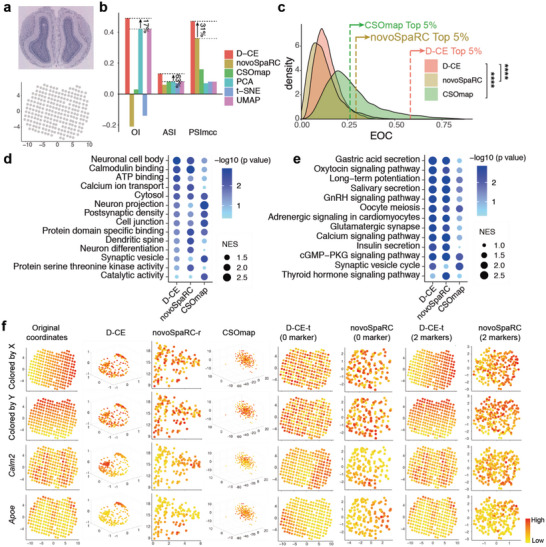
Figure 5.

Spatial reconstruction and spatial marker gene detection of mouse olfactory bulb spatial transcriptomic dataset with D‐CE, novoSpaRC, CSOmap, PCA, t‐SNE, and UMAP. a) Illustration of the mouse olfactory bulb spatial transcriptomic data. Tissue staining picture reproduced from Berglund, E. et al. (upper panel) and original coordinates of all samples (lower panel). b) Barplot of OI, ASI and PSImcc. The percentage of improvement by D‐CE over the second‐best method is labeled for each index. c) Density plot of all expressed genes to the reconstructed coordinates by D‐CE, novoSpaRC, and CSOmap. The dashed line indicates the EOC position of top 5% genes in each distribution. Student's t‐test was used to compare the difference between D‐CE and the other two methods. d,e) GSEA analysis of GO d) and KEGG e) enrichment terms of top 5% EOC genes in panel (c). f) Original coordinates, D‐CE, novoSpaRC, and CSOmap without marker and template fitting, D‐CE‐t with 0 marker, novoSpaRC with template fitting and 0 marker, D‐CE‐t with 2 marker, and novoSpaRC with 2 marker from the first to the eighth column reconstructed coordinates colored according to the X axis, Y axis, and the top two D‐CE markers’ (Calm2 and Apoe) expression level from the first to the fourth row, respectively. NovoSpaRC randomly selects 1 or 2 markers for marker‐based template fitting, the best result among 100 trials is used for novoSpaRC.
