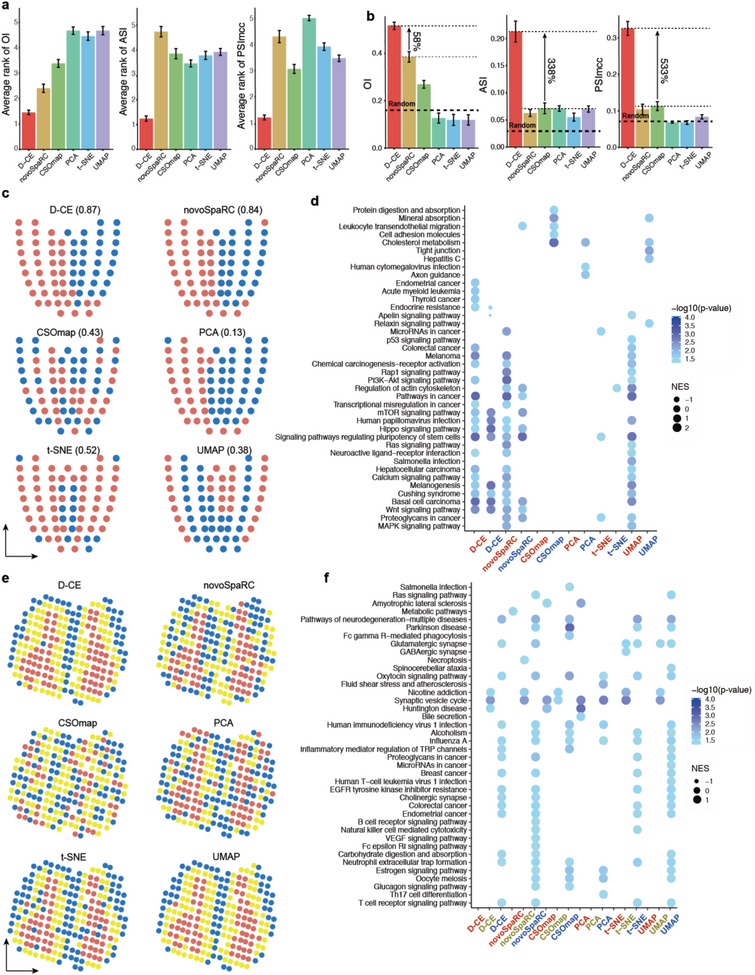
Figure 6.

Performance summary and comparison to existing methods and organization and makers of D‐CE into spatial domains. a,b) Average rank g) and values h) of OI, ASI and PSImcc by D‐CE, NovoSpaRC, CSOmap, PCA, t‐SNE, and UMAP on 484 reconstructions from 10 datasets that contain precise sample coordinates on templates. The best performance is ranked 1. Whiskers denote standard deviations. OI is transformed by (1+index)/2 to render all the indexes with a range from 0 to 1. Then each index is normalized by subtracting a baseline value obtained by the average of 100 label‐randomization of the samples. CSOmap is only applicable to 9 datasets and 483 reconstructions (without BDTNP dataset) due to its limit to human and mouse data and LR genes only. Student's t‐test p‐value are labeled on top. The percentage of improvement by D‐CE over the second‐best method is labeled for each index. c) Domain structures and compositions of mouse embryo Geo‐seq data revealed by D‐CE, novoSpaRC, CSOmap, PCA, t‐SNE, and UMAP. The reconstructed coordinates are clustered by k‐means (k = 2), visualized by 2 different colors on the illustrative “corn plot.” Jaccard Index of the two clusters to A and P domains are labeled within the brackets. d, GSEA of KEGG pathways for top 500 cluster specifically up‐regulated genes in all 6 methods. e,f) The same layout as shown in panel (c) and (d) for mouse olfactory bulb data. The reconstructed coordinates are clustered by k‐means (k = 3) and visualized by 3 different colors on the template.
