Figure 2.

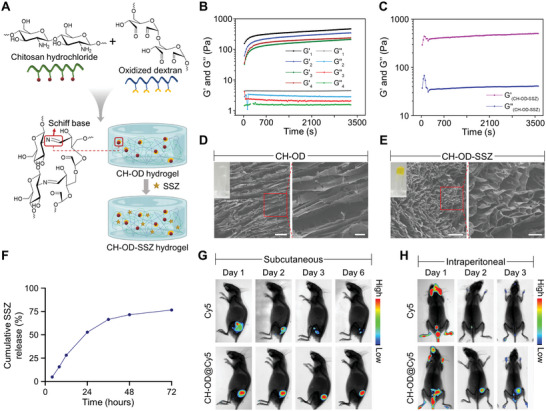
The construction of CH‐OD‐SSZ hydrogel and drug‐releasing behaviors. A) Schematic representation of Schiff's base reaction between CH and OD and CH‐OD‐SSZ hydrogel. B) Time evolution of storage modulus (G') and loss modulus (G“”) for 3.5% (w/v) CH‐OD hydrogel at 37 °C with different feed ratios. The ratio of amino groups in CH to aldehyde groups in OD is 1.5:1 (Group 1), 1:1 (Group 2), 1:1.5 (Group 3), and 1:2 (Group 4). C) Time evolution of G' and G“” for CH‐OD‐SSZ hydrogel at 37 °C. D,E) Scanning electron microscope (SEM) images of the representative lyophilized CH‐OD hydrogel (D) and CH‐OD‐SSZ hydrogel (E) (Scale bar [left] = 20 µm, Scale bar [right] = 5 µm). Insets in the upper left corner are photographs of the two kinds of hydrogel. F) Release of SSZ from CH‐OD‐SSZ hydrogel loaded at 16 mg mL−1 in 0.1 m PBS solution in vitro. The amounts of SSZ released from hydrogel are normalized to initial amounts of SSZ loaded to each hydrogel formulation. The data are presented as the mean ± SEM of three independent experiments. G) Fluorescence images of mice taken on days 1, 2, 3, and 6 after subcutaneous injection of free Cy5 or CH‐OD@Cy5 hydrogel. H) Fluorescence images of mice taken on days 1, 2, and 3 after peritoneal injection of free Cy5 or CH‐OD@Cy5 hydrogel.
