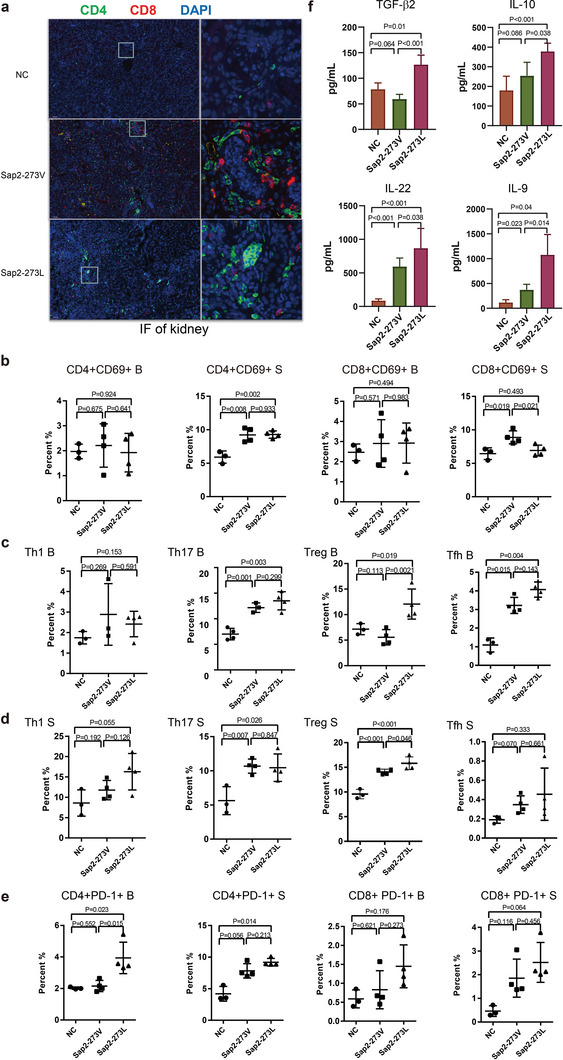
Figure 5.

Genetically engineered Sap2‐273L strain triggered a stronger immunosuppressed microenvironment. Mice were intravenously injected with an equal amount of Sap2‐273L (n = 4), Sap2‐273V strains (n = 4), or PBS (n = 3) (1 × 10⁵ CFU/mouse). At day 12 post infection, a) CD4+/CD8+ T cells (green/red) infiltration and C3b deposition (yellow) were detected by immunofluorescent staining of the kidney. b) The early activation of CD4+/CD8+T cells in B (blood) and S (spleen) was analyzed by flow cytometry. CD4+CD69+ population indicated the early activation of CD4+ T cells, and CD8+CD69+ population was early activation of CD8+ T cells. c,d) The differentiation of CD4+ T help cells in the B (blood) (c) and S (spleen) (d) analyzed by flow cytometry. Th1 cells, Th17, and Treg cells were classified by the positive expression of T‐bet, RORγT, and FoxP3. Tfh cells were identified by the high expression of CXCR5 and PD‐1. e) The exhaustion of CD4+/CD8+ T cells in B (blood) and S (spleen) was detected by expression of immune checkpoint molecule PD‐1. f) The levels of different cytokines released in serum at day 12 post infection. Mice were intravenously infected with the same amount of Sap2‐273L, Sap2‐273V strains, or PBS (n = 8 per group) (1 × 10⁵ CFU/mouse). The cytokines in serum were detected by cytometric bead array. Data are shown as means ± SD, and from one of three independent experiments. The p values were calculated by the Student's t‐test.
