
Figure 3.
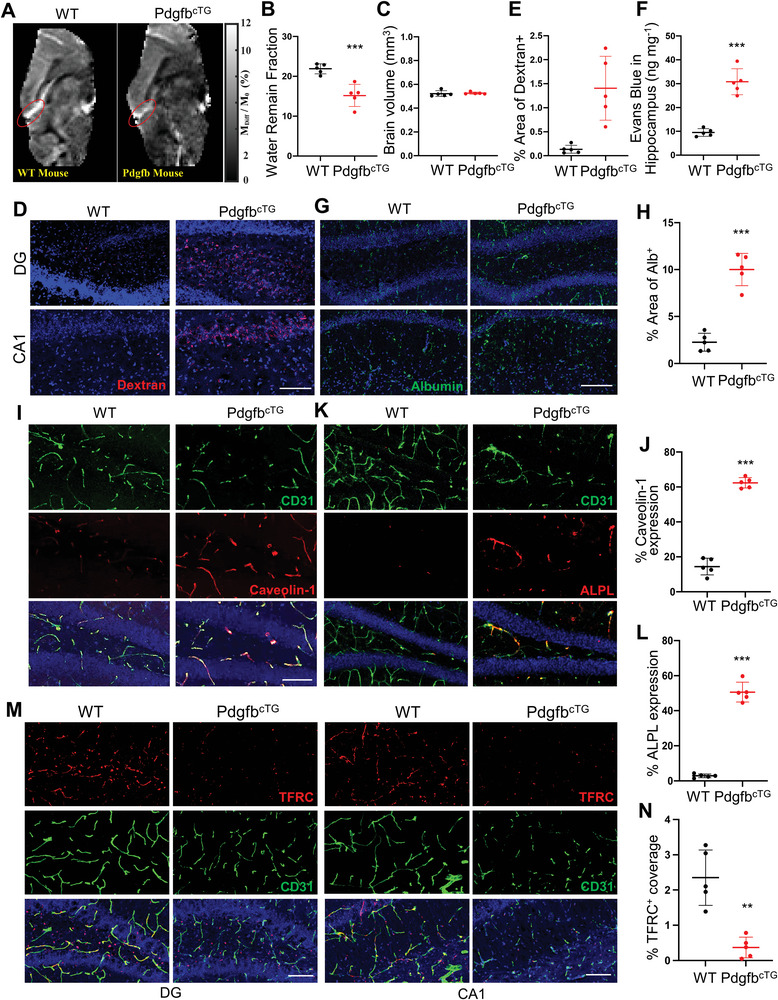
Conditional Pdgfb transgenic mice recapitulate aged BBB phenotype. A–C) MRI measurements of 6‐month‐old PdgfbcTG mice and WT littermates. (A) Presents the WEPCAST images, red ellipsoid shows the calculated vein of mouse brain. (B) Water Remain Fraction and (C) brain volume. The great cerebral vein of Galen was marked with an ellipsoid to show the WEPCAST signal difference between WT and PdgfbcTG mice. D,E) BBB permeability was quantified from the leaking of 10 kDa dextran‐conjugated fluorophores into the DG and CA1 parenchymal space outside the vessels in 6‐month‐old PdgfbcTG mice and WT littermates. Vessels were identified by the CD31(green), while leaks were identified by leakage (red) of fluorescence outside the vessels (D). Scale bar, 100 µm. DAPI stains nuclei as blue. (E) BBB leakage is quantified by percentage of Dextran+ signal area comparing in hippocampus of 6‐month‐old PdgfbcTG mice and WT littermates. n = 5. F) In vivo Evans blue permeability assay in hippocampus in 6‐month‐old PdgfbcTG mice and WT littermates. n = 5. G) Representative immunofluorescence images of DG and CA1 region of hippocampus from PdgfbcTG mice and WT littermates using antibody against albumin. DAPI stains nuclei blue. Scale bar, 100 µm. H) Quantification of Albumin+ signal covered area using Image J. n = 5. I) Representative confocal images of CD31 (green) and Caveolin‐1 (red) double‐immunofluorescence staining in DG region of 6‐month‐old PdgfbcTG mice and WT littermates. DAPI stains nuclei as blue. Scale bar, 100 µm. J) Quantification of Caveolin‐1 expression of the capillaries in hippocampus. K) Representative confocal images of CD31 (green) and ALPL (red) immunofluorescence staining in DG region of 6‐month‐old PdgfbcTG mice and WT littermates. DAPI stains nuclei as blue. Scale bar, 100 µm. L) Quantification of ALPL expression of the capillaries in hippocampus. n = 5. M) Representative confocal images of CD31 (green) and TFRC (red) double‐immunofluorescence staining in DG region of 6‐month‐old PdgfbcTG mice and WT littermates. DAPI stains nuclei as blue. Scale bar, 100 µm. N) Quantification of TFRC expression of the capillaries in hippocampus. Data are shown as the mean ± SD, **p<0.01, ***p<0.001, as determined by unpaired two‐tailed Student's t test.