
Figure 5.
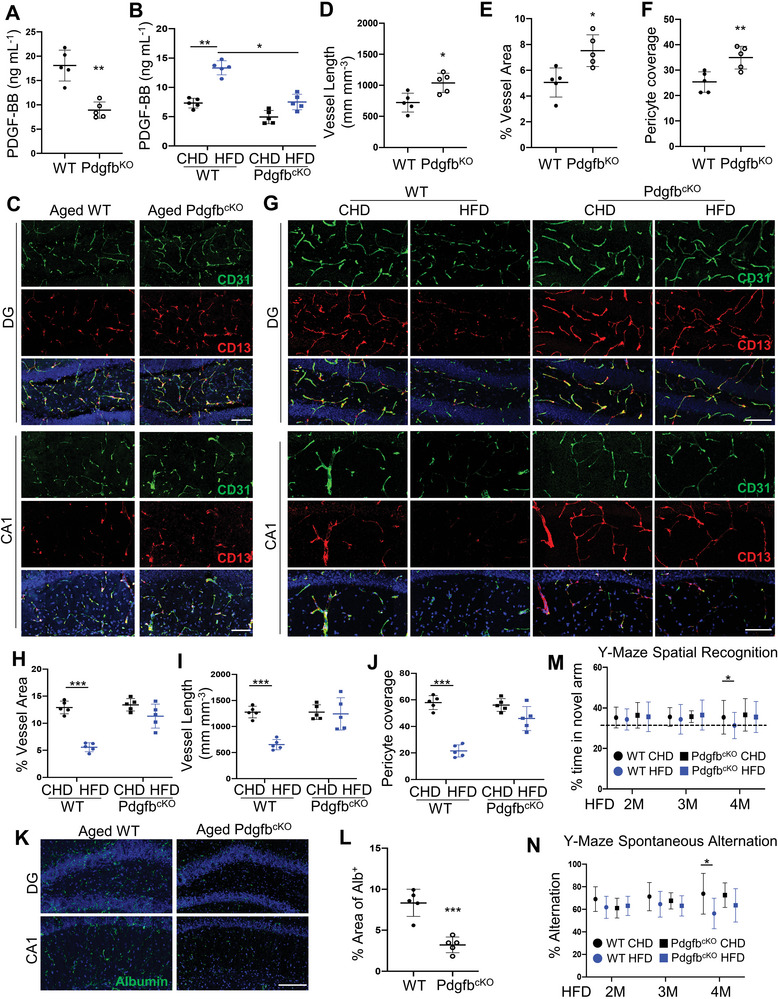
Normalizing the circulating PDGF‐BB ameliorates hippocampal microvascular impairment and cognitive decline. A) ELISA analysis of serum PDGF‐BB concentration in 18‐month‐old PdgfbcKO mice and WT littermates. B) PdgfbcKO mice and WT littermates were fed HFD or CHD for 4 months, starting from 3 months of age. ELISA analysis of serum PDGF‐BB concentration. C) Representative confocal images of CD31 (green) and CD13 (red) double‐immunofluorescence staining in DG and CA1 region in 18‐month‐old PdgfbcKO mice and WT littermates. DAPI stains nuclei blue. Scale bar, 100 µm. D–F) Quantification of the percentage of vessel length (D), vessel area (E), and CD13+ pericyte coverage of the capillaries in hippocampus (F), n = 5. G) Representative confocal images of CD31 (green) and CD13 (red) double‐immunofluorescence staining in DG and CA1 region in CHD versus HFD PdgfbcKO mice. DAPI stains nuclei blue. Scale bar, 100 µm. H–J) Quantification of the percentage of vessel area (H), vessel length (I), and CD13+ pericyte coverage of the capillaries in hippocampus (J), n = 5. K) Representative immunofluorescence images of DG and CA1 region of hippocampus from mice of 18‐month‐old PdgfbcKO mice and WT littermates using antibody against albumin. DAPI stains nuclei as blue. Scale bar, 100 µm. L) Quantification of Albumin+ signal covered area using Image J. M,N) Cognitive mouse behaviors in CHD versus HFD PdgfbcKO mice were assessed. Mice were tested for spatial recognition (M) and spontaneous alternation (N) in Y‐maze. n = 10. *p<0.05, **p<0.01, ***p<0.001 as determined by unpaired two‐tailed Student's t test (for 2 group comparison) or One‐way ANOVA (for multiple group comparison).