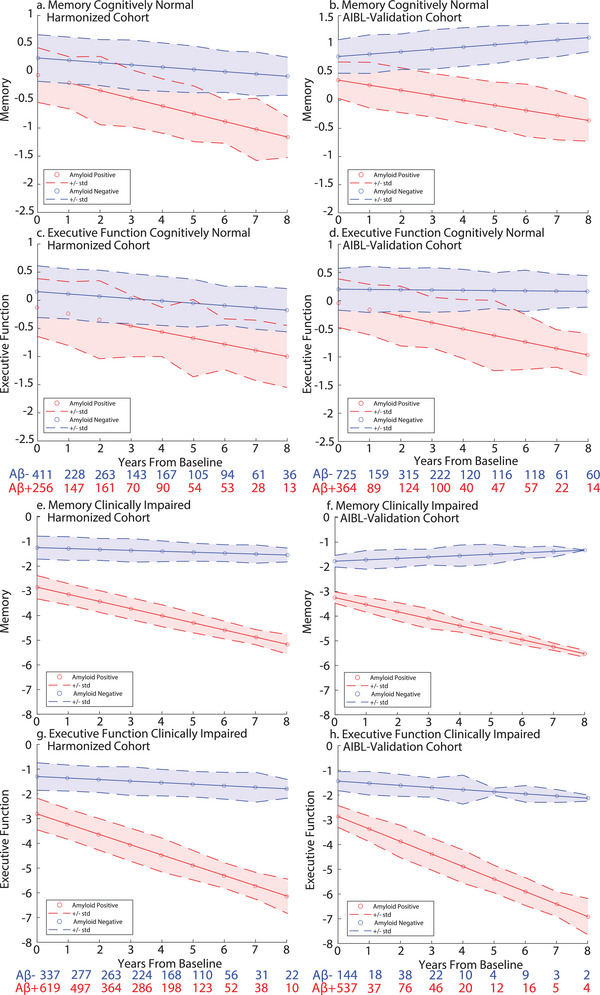
FIGURE 4.

Executive function and memory trajectories. CN memory and executive function trajectories a, c. Harmonization cohort; b, d. AIBL Validation cohort. Expected trajectories for an Aβ− (blue) and an Aβ+ (red) 70‐year‐old women with an education of 14 years with no cognitive impairment (i.e., CN) at baseline. Error bars represent standard deviation of the residual of the fit from the LME model. Numbers below the plots show the sample size at different years of follow‐up. Clinically impaired memory and executive function trajectories. e, g, Harmonization cohort; f, h, AIBL Validation cohort. Expected trajectories for an Aβ− (blue) and an Aβ+ (red) 70‐year‐old woman with an education of 14 years with cognitive impairment (i.e., MCI or AD) at baseline. AD, Alzheimer's disease; AIBL, Australian Imaging, Biomarker & Lifestyle Flagship Study of Ageing; CN, cognitively normal; LME, linear mixed effects; MCI, mild cognitive impairment
