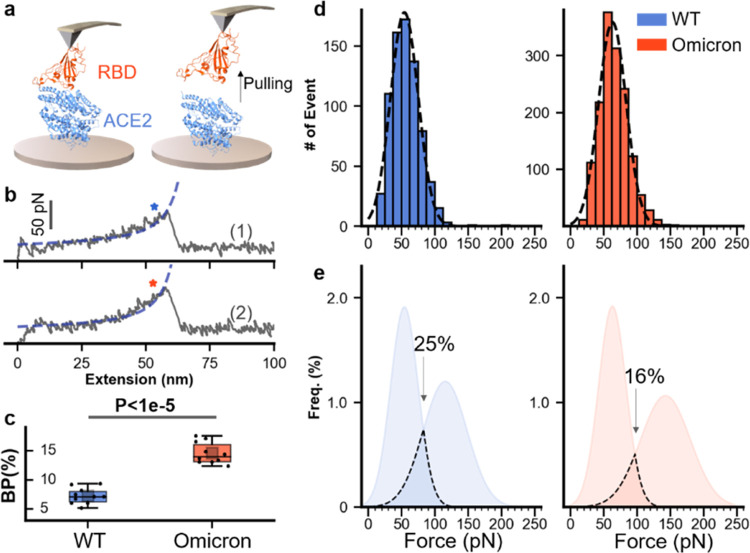
Figure 5.
AFM-SMFS unbinding experiment of the RBD–ACE2 complex. (a) Schematic of the measurement of the unbinding between RBDs and ACE2 using SMFS. RBD and ACE2 are immobilized to the AFM tip and the substrate, respectively. (b) Representative force–extension curves show the unbinding peak from RBD–ACE2 interaction. WT is colored blue (top), and Omicron is orange (bottom). (c) Box plot of the binding probabilities shows a higher value for Omicron than that for WT (14.6 vs 7.3%). One data point belongs to the BP from one experiment (10 in total). The box indicates the 25th and 75th percentiles. P values were determined by a two-sample t-test. (d) The unbinding force distribution of the RBD–ACE2 complex. Dashed lines represent the Gaussian fit of the result. (e) The merged results of unfolding and unbinding for WT and Omicron RBDs. Overlap of the force distribution is observed for both WT (25%) and Omicron (16%) under experimental conditions.

