
Figure 3.
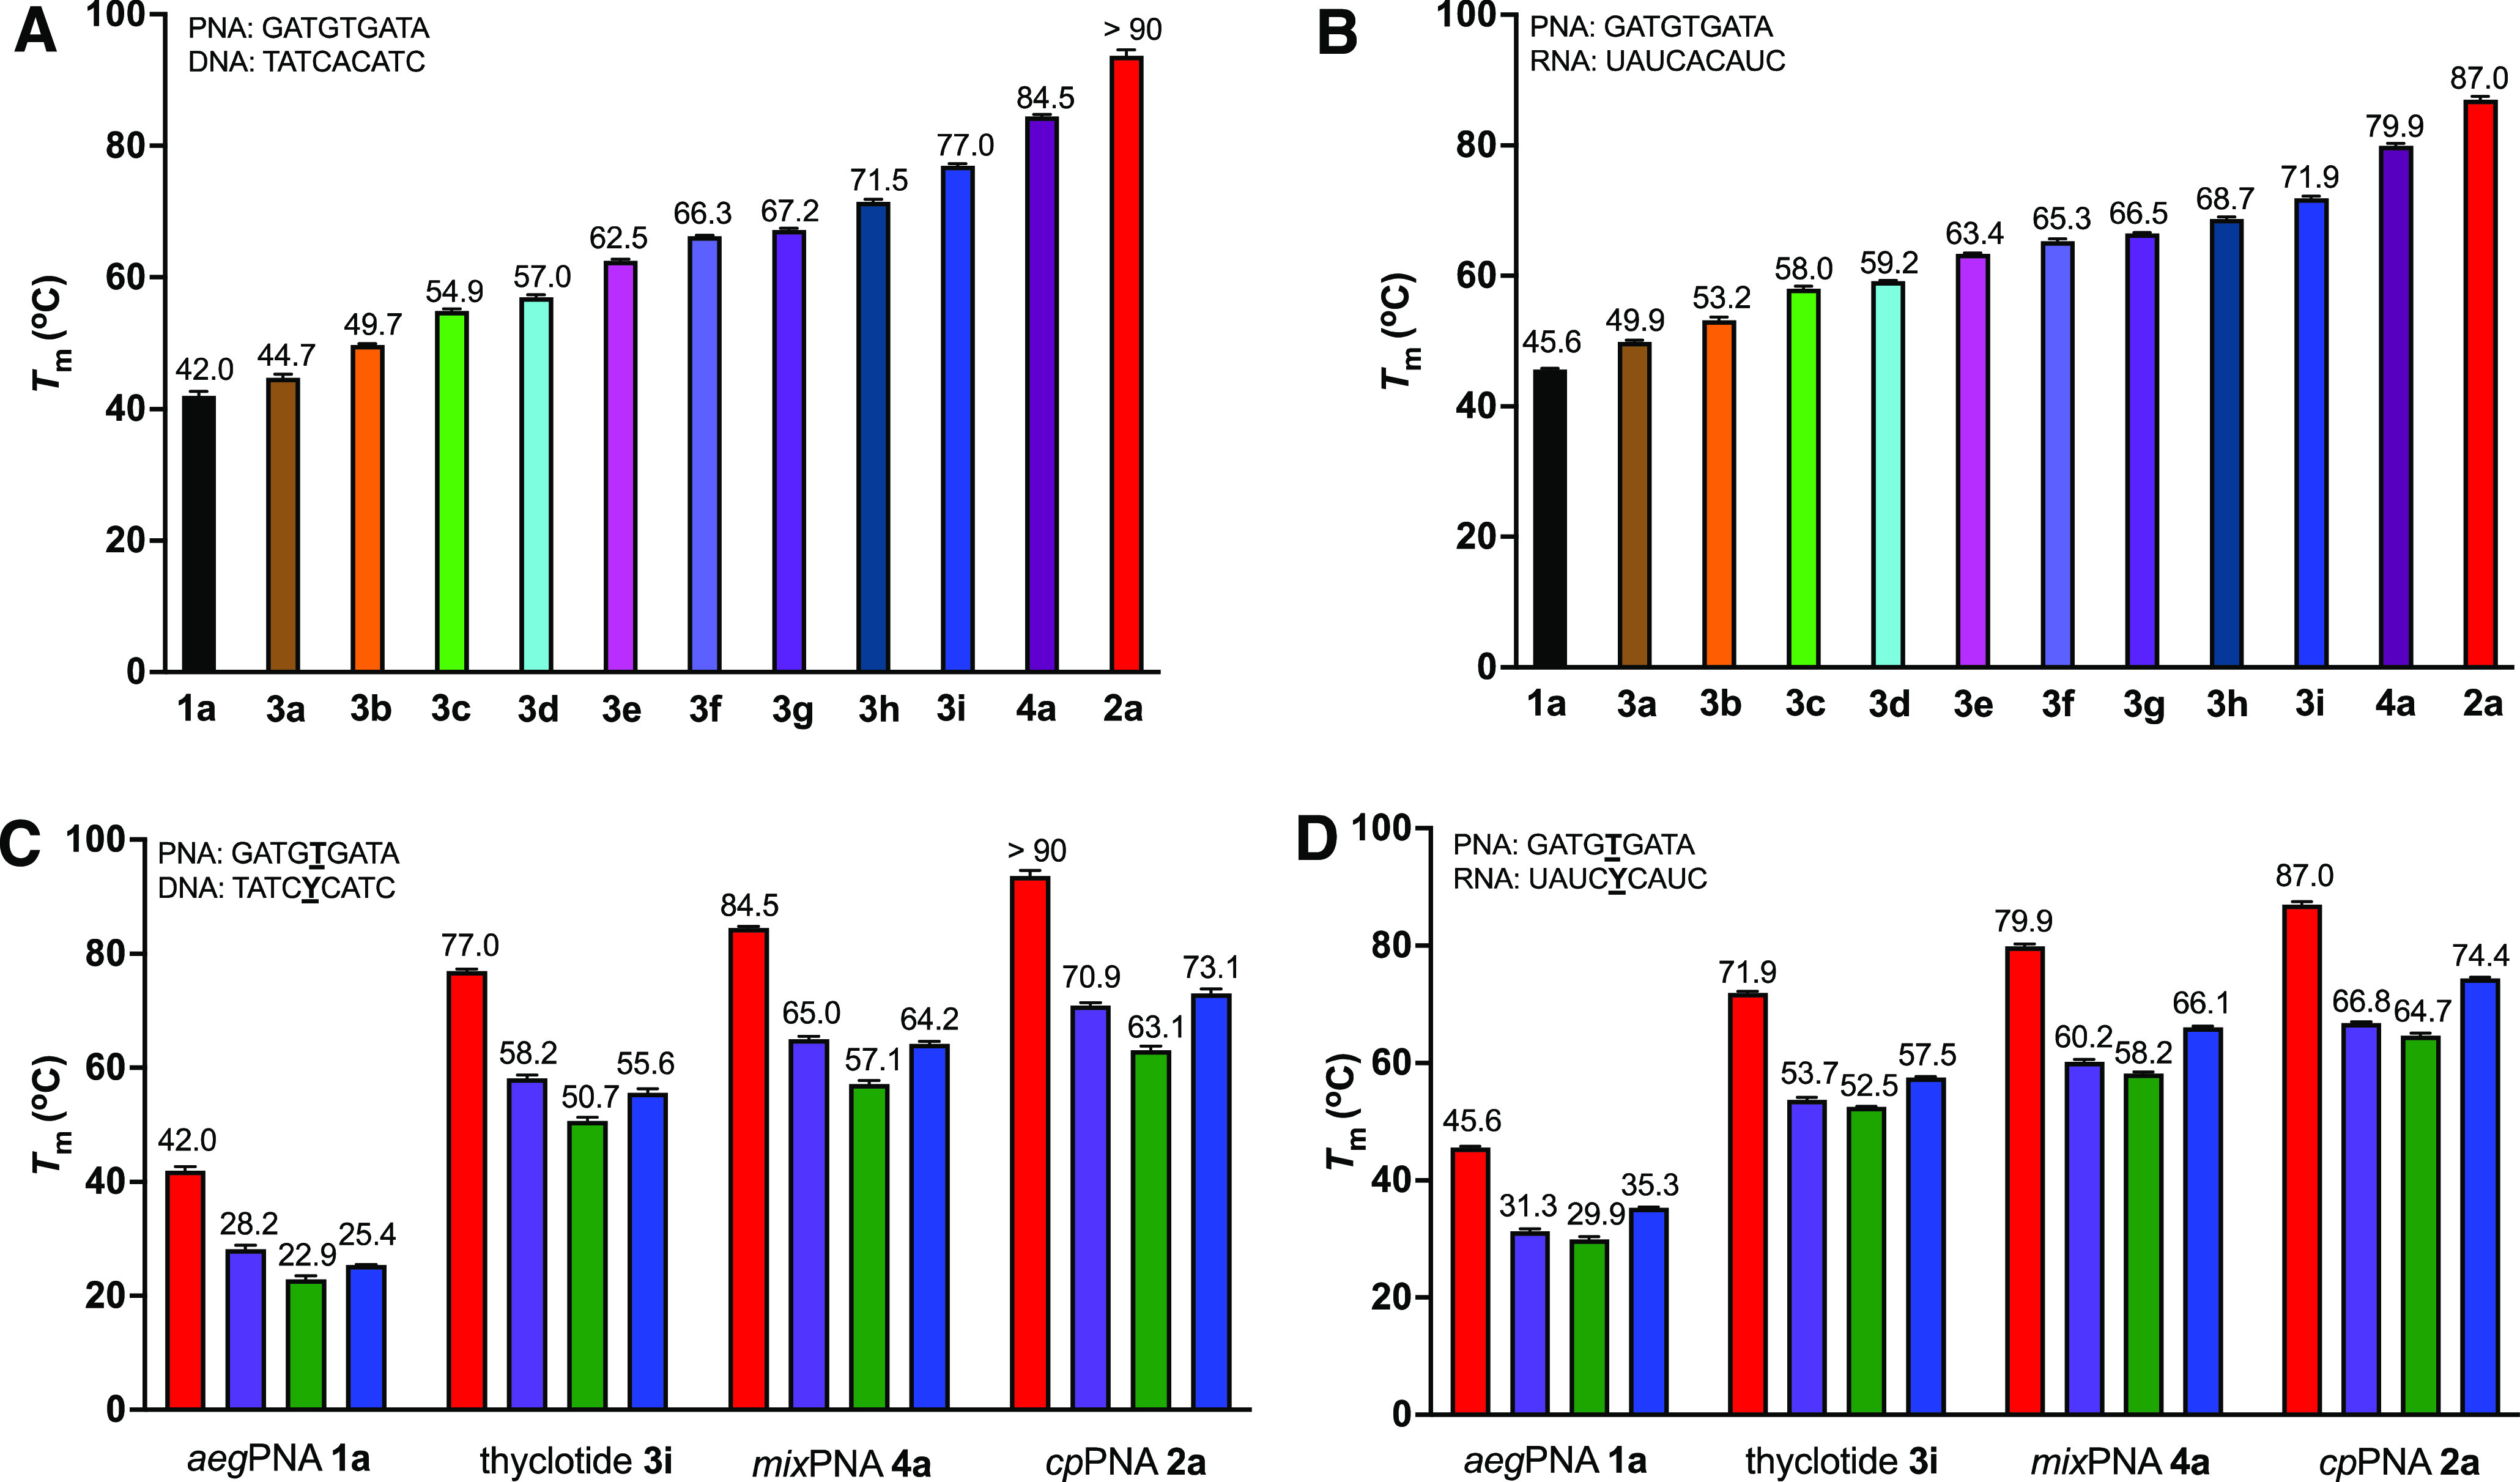
Thyclotide exhibits strong binding properties to oligonucleotides. (A) Melting temperatures for PNA–DNA duplexes (1 μM individual strand concentration) in PBS. (B) Melting temperature data for PNA–RNA duplexes (1 μM individual strand concentration) in PBS. (C) Comparison of single base mismatch discrimination between aegPNA, thyclotide, and cpPNA for DNA binding. Color codes for Y in the DNA strand: A (red), T (purple), C (green), and G (blue). (D) Comparison of single base mismatch discrimination between aegPNA, thyclotide, and cpPNA for RNA binding. Color codes for Y in the RNA strand: A (red), U (purple), C (green), and G (blue).