
Scheme 2. Energy Correlation Diagram, Energy Terms, and Associated States in Multistate Energy Decomposition Analysis.
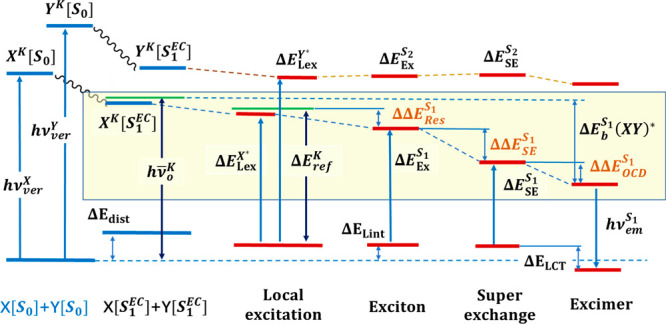
[S0] and [S1EC] indicate geometries of X and Y in the respective equilibrium ground state and that in optimized exciplex complex (EC) in the first excited state. Blue lines are monomer compounds, and maroon lines denote dimer structures. Energies that can be observed spectroscopically are indicated by hν, except for local excitations given in relative energies. Resonance and delocalization energies are given in brown. Energy changes in light yellow shade are associated with the exciplex binding energy.