
Fig. 3.
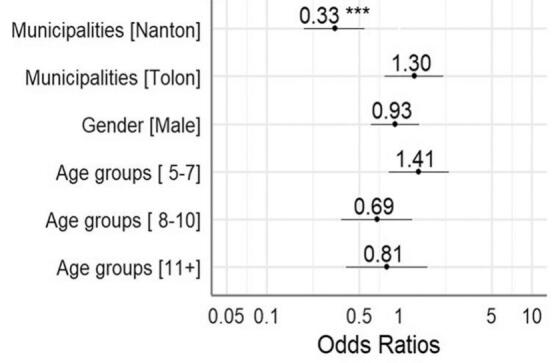
Multivariable analysis of malaria risk of children.
The y-axis labels are characteristics of the participants and x-axis labels are odds ratios (OR). The OR for each y-axis label is the aligned value in the plot. The black-dots represents the OR values and its whiskers indicates 95% confidence interval ranges. ** p-value <0.01, *** p-value <0.001.