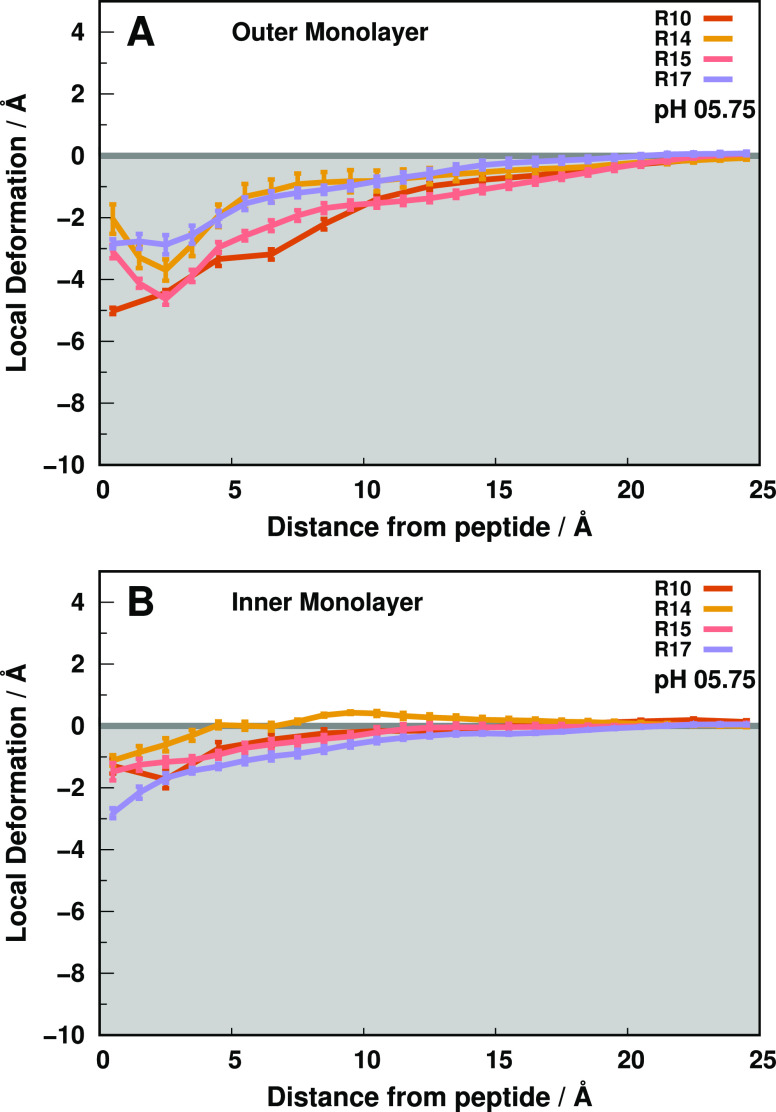
Figure 5.
Outer (A) and inner (B) local monolayer deformation values in the xy plane along the peptide distance. Each colored trend represents the membrane deformations induced by one of the peptide variants at pH 5.75 until the “bulk” lipids (15 to 25 Å). The error bars represent a standard error of the mean at every 1.0 Å.

