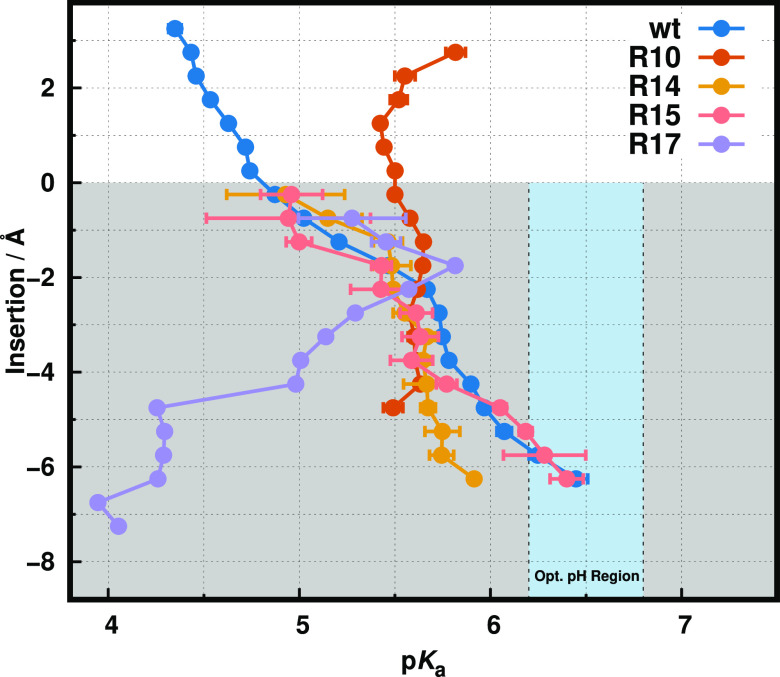
Figure 6.
pKa profiles of wt-pHLIP and its Arg variants. Each pKa trend shows the shift along the membrane normal. The white and gray-shaded regions correspond to the water phase and membrane interior, respectively. The light blue vertical stripe identifies the pH region ideal for TME selection. The wt-pHLIP data were adapted from ref (8). The R10 and R17 profiles showed significant sampling limitations at deeper membrane insertion regions (<−5 Å), which resulted in the absence of data points (R10) or higher error values (more than one pK unit), which were omitted for clarity (R17).

