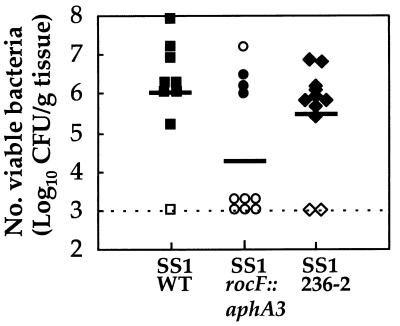
FIG. 5.
In vivo colonization of mice by WT and rocF mutants of H. pylori SS1. Bacterial loads were enumerated by quantitative culture on samples obtained 1 month postinoculation. The limit of detection is indicated by the dotted line. Symbols along the dotted line indicate that the strain failed to colonize the mouse. Urease-positive (solid symbols) and -negative (open symbols) gastric biopsy samples are also shown. Each point corresponds to a determination for a single mouse. Solid lines indicate the mean log10 of viable CFU per gram of tissue. In a second experiment (quantitative data not shown in the figure), the numbers of mice colonized with the WT, 236-2 rocF mutant, and rocF::aphA3 mutant were 64% (7 of 11), 100% (10 of 10), and 56% (5 of 9), respectively.

