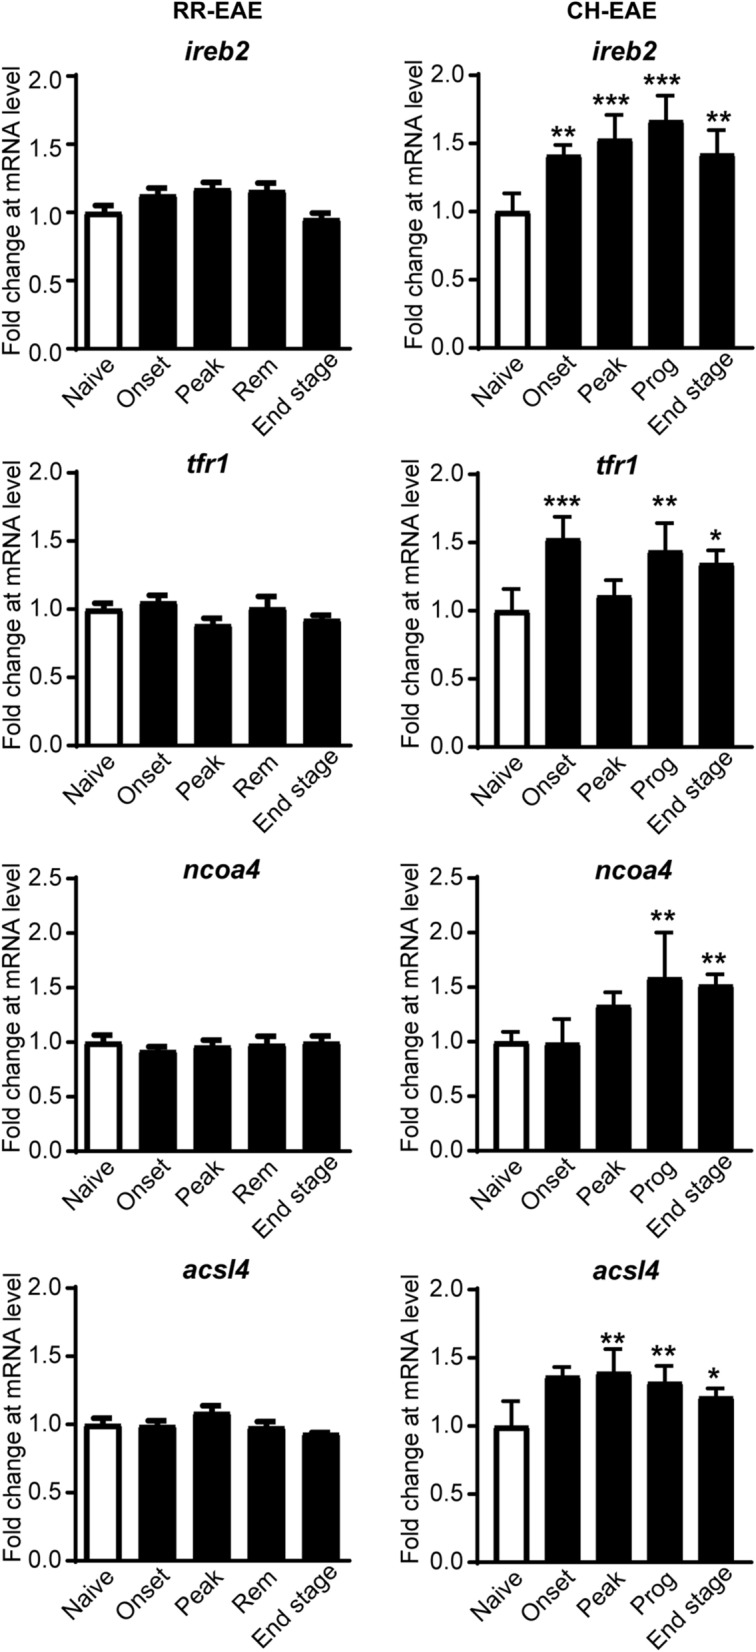
Fig. 1.

mRNA expression of select ferroptosis markers in CH-EAE and RR-EAE. Q-PCR screen of a select panel of ferroptosis markers at various stages of RR-EAE and CH-EAE. Note the significant increases in mRNA levels of ireb2, tfr1, ncoa4 and acsl4 in CH-EAE but not RR-EAE. (For CH-EAE (i) ireb2; naïve vs. onset and end stage: p = 0.003; naïve vs. peak and progressive stages: p < 0.001; F(4, 19) = 12.54, p < 0.001 (ii) tfr1; naïve vs. onset, prog and end stage respectively: p < 0.001,p = 0.003 and p = 0.02; F(4, 19) = 10.99, p < 0.001 (iii) ncoa4; naïve vs. prog and end stage respectively: p = 0.004 and p = 0.007; F(4, 19) = 8.446, p < 0.001 (iv) acsl4; naïve vs. onset and peak stage respectively: p = 0.002 and p = 0.001; naïve vs. prog: p = 0.01; F(4, 19) = 7.406, p < 0.001. n = 4–5 per group, one-way ANOVA with Tukey’s multiple comparison test. *p < 0.05, **p < 0.01 and ***p < 0.001
