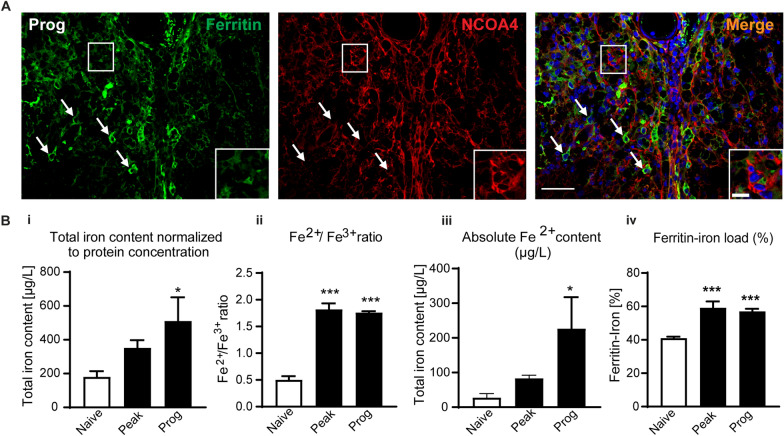
Fig. 3.
Expression of NCOA4 and ferritin, and Fe2+/Fe3+ iron levels in CH-EAE. A Double immunofluorescence labeling of rabbit anti-ferritin and mouse anti-NCOA4 shows that cells strongly expressing NCOA4 have reduced ferritin staining (suggesting ferritinophagy) (cells in rectangle, and in inset), while cells that express low levels of NCOA4 show high ferritin staining (arrows). B Data from CE-ICP-MS assay showing Bi total iron content in spinal cord normalized to protein concentration. Shows incremental increase in iron from naïve to peak and progressive stages of CH-EAE; naïve versus prog: p = 0.02; F(2, 11) = 4.5, p = 0.037. Bii the ratio of Fe2+/Fe3+ which indicate about 3.5-fold increase in redox active iron in the spinal cord at the peak and progressive stages compared to naïve (normal) spinal cord; naïve versus peak and prog: p < 0.001; F(2, 12) = 92.60, p < 0.001. Biii Absolute Fe2+ content in µg/L. Graph shows an incremental increase in Fe2+ content with disease progression; naïve versus prog: p = 0.05; F(2, 12) = 3.74, p = 0.05. Biv Graph showing the amount of iron loaded into ferritin. Data shows increase in the percentage of iron loading of ferritin in CH-EAE from ~ 40% in naïve control samples to ~ 60% at the peak and progressive stages: naïve versus peak and prog: p < 0.001 and p = 0.001; F(2, 12) = 17.15, p < 0.001. n = 4–5 per group, one-way ANOVA with Bonferroni’s multiple comparison test. *p < 0.05, **p < 0.01 and ***p < 0.001. Scale bars: 40 µm; Inset:10 µm

