Fig. 5.
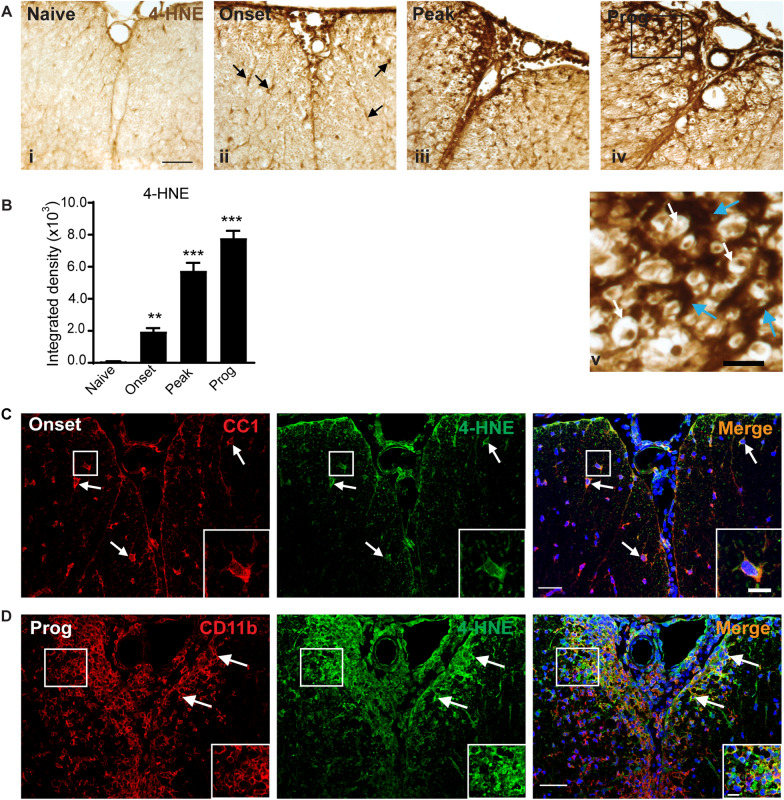
Lipid peroxidation in the spinal cord in CH-EAE. A Changes in 4-HNE labeling in the spinal cord in normal (naïve) mice and mice at different stages of CH-EAE detected by DAB-immunohistochemistry. Note the lack of 4-HNE labeling in naïve spinal cord (Ai), and gradually increasing labeling at the onset (Aii), peak (Aiii) and progressive (Aiv) stages of the disease. Panel Av shows higher magnification of the area outlined in the black rectangle in Aiv. In panel Av, note the dark 4-HNE labeling of glial processes (blue arrows) that surround myelinated axons (white arrows). Scale bar in Ai: 30 µm; Av: 10 µm. B Graph shows quantification by densitometry of the 4-HNE labeling. Note the progressive increase in 4-HNE with progression of the disease. Naïve versus onset, peak and prog: p = 0.008 and p < 0.001 respectively; F(3, 16) = 100.2, p < 0.001, n = 5 per group, one-way ANOVA with Tukey’s multiple comparison test, **p < 0.01 and ***p < 0.001. C-D Double immunofluorescence labeling shows co-localization of 4-HNE labeling to CC1+ oligodendrocytes at the onset stage (C) and CD11b+ macrophages at the progressive stage of CH-EAE (D). Double-labeled cells are outlined in the white rectangles and shown at higher magnification in bottom right of each panel. Scale bars: 40 µm; Inset: 12 µm

