Fig. 6.
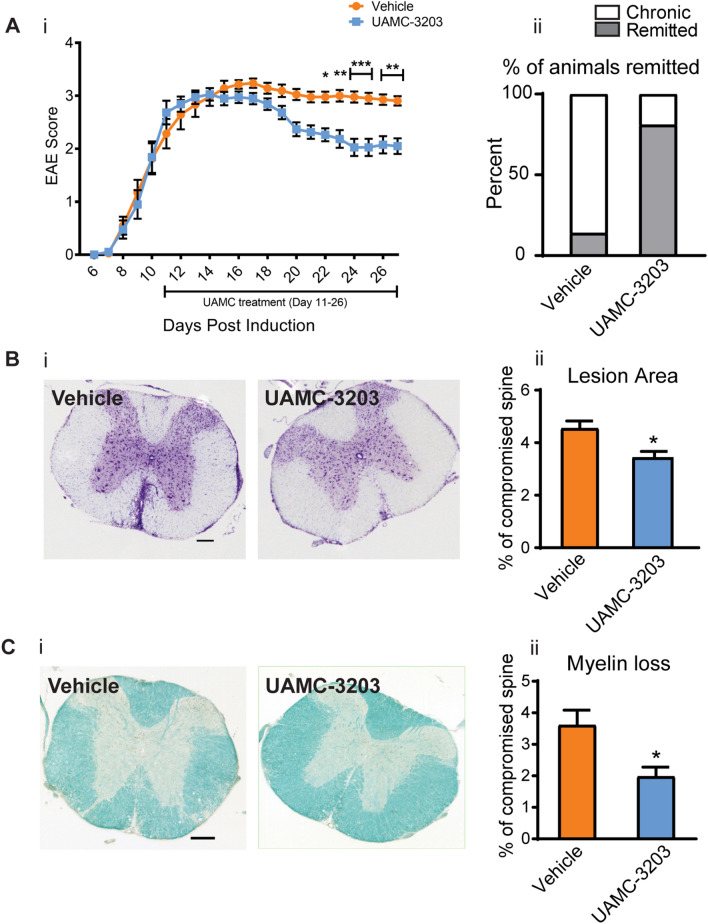
Ferroptosis inhibitor treatment improves clinical and histological outcomes in CH-EAE. (Ai) Graph showing population scores of EAE paralysis of pooled data from 2 experiments. Note the UAMC-3203 treated mice show significant improvement from day 22. Vehicle treated vs. UAMC treated at day 22: p = 0.03; day23: p = 0.007; day 24 & 25: p < 0.001; day 26 & 27: p = 0.003; F(1,838) = 48.34, p < 0.001, n = 19–21 per group, two-way ANOVA with Bonferroni’s multiple comparison test. Aii Shows the number of animals that remitted to a score of 2 or below. This analysis reveals that only 14% of the vehicle treated mice remitted while about 81% of the UAMC-3203 treated group remitted. Bi Cresyl violet staining of cross-sections of the thoracic spinal cord from vehicle and UAMC-3203 treated mice at 27 days after immunization. Note the cellular infiltrates in the EAE lesions in the vehicle treated group . Bii Quantification of the size of the lesions shows significant reduction in the UAMC-3203 treated group. Ci LFB staining of thoracic spinal cord cross-sections from vehicle and UAMC-3203 treated group. Note the demyelinated areas in the vehicle treated group . Cii Quantification of LFB staining shows a significant reduction in myelin loss in the UAMC-3203 treated group. Bii and Cii: Vehicle treated versus UAMC treated: p = 0.01 (Bii) and p = 0.02 (Cii). n = 4–5 per group, Mann–Whitney test, *p < 0.05. Scale bars: 35 µm

