Fig. 7.
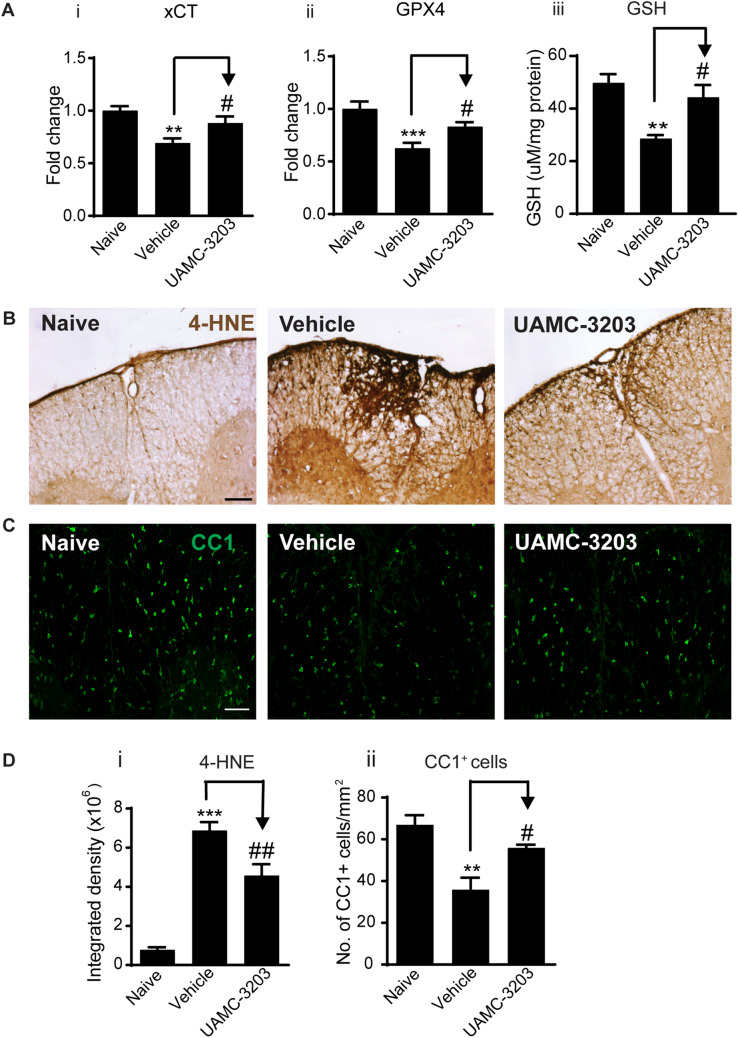
UAMC-3203 treatment induces improvement in other outcome measures. A Western blot data show increased expression of xCT (Ai) and GPX4 (Aii) in UAMC-3203 treated as compared to vehicle treated CH-EAE mice. (Aiii) GSH levels measured by a colorimetric method also increase in the UAMC-3203 treated group as compared to vehicle treated CH-EAE mice. B DAB-immunohistochemical staining of 4-HNE in naïve, vehicle treated, and UAMC-3203 treated CH-EAE mice. Note the reduction in 4-HNE labeling in the UAMC-3203 treated mice. Quantification of this labeling shows significant reduction in 4-HNE in the inhibitor treated group as compared to vehicle treated CH-EAE mice (Di). C Immunofluorescence labeling of CC1+ oligodendrocytes in naïve, vehicle treated, and UAMC-3203 treated CH-EAE mice. Quantification of CC1+ cells indicate a significant increase in the UAMC-3203 treated mice compared to vehicle treated CH-EAE mice (Dii). Scale bar in B: 40 µm; C: 60 µm. (Ai xCT: Naïve versus Vehicle treated: p = 0.002; Vehicle treated vs. UAMC-3203 treated: p = 0.048; F(2, 15) = 9.129, p = 0.0022. Aii. GPX4: Naïve versus Vehicle treated: p < 0.001; Vehicle treated vs. UAMC-3203 treated: p = 0.048; F(2, 15) = 11.30, p = 0.001. For Ai and Aii: n = 6 per group, one-way ANOVA with Tukey’s multiple comparison test. Aiii GSH level: Naïve versus Vehicle treated: p = 0.002; Vehicle treated versus UAMC-3203 treated: p = 0.02; F(2, 12) = 10.33, p = 0.002; n = 5 per group, one-way ANOVA with Tukey’s multiple comparison test. Di. Naïve versus Vehicle and UAMC-3203 treated: p < 0.001; F(2, 12) = 254.8, p < 0.001; n = 5 per group, one-way ANOVA with Tukey’s multiple comparison test, Dii. Naïve versus Vehicle treated: p = 0.002; Vehicle treated vs. UAMC-3203 treated: p = 0.02; F(2, 9) = 13.13, p = 0.002, n = 4 per group, one-way ANOVA with Tukey’s multiple comparison test,*,#p < 0.05,**,##p < 0.01 and ***p < 0.001

