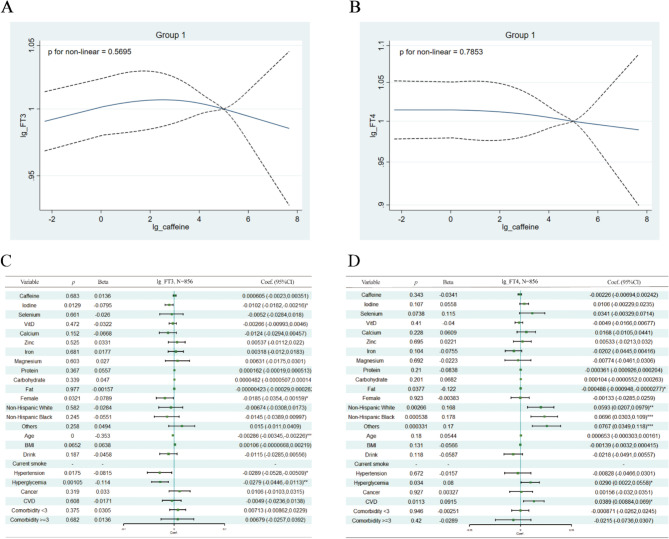
Fig. 5.
Relationship between Serum FT3 and Serum FT4 with Caffeine Intake in Group 1. (A-B): Nonlinear Relationship Evaluation using the RCS Model. (C-D): Results of Multivariable Linear Regression Analysis. Adjustments were made for gender, race, age, BMI, drinking and smoking habits, hyperglycemia, hypertension, cardiovascular disease (CVD), cancer, comorbidities, urinary iodine, and intake of micronutrients (selenium, vitamin D, calcium, zinc, iron, magnesium) and macronutrients (protein, carbohydrate, and fat). Caffeine, FT3, FT4, urinary iodine, and micronutrient intake were log-transformed

