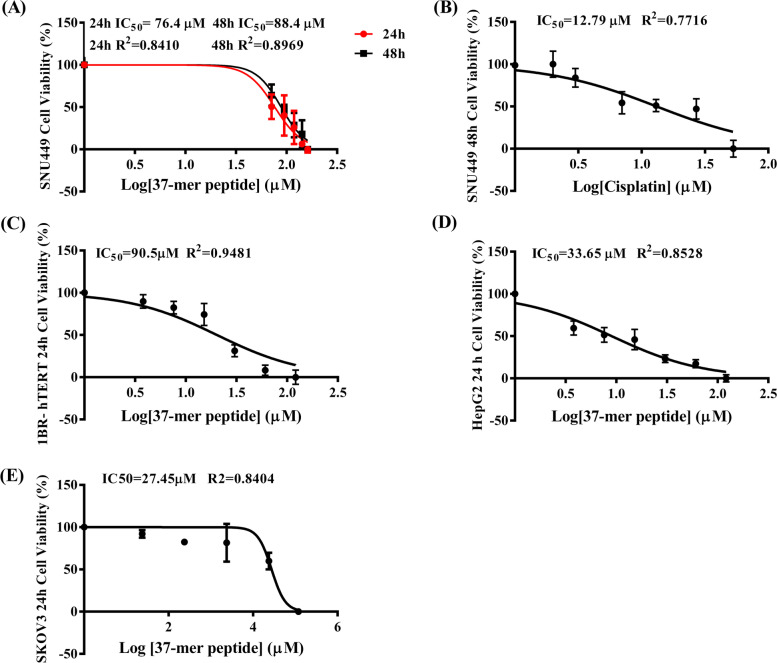
Fig. 4.
Dose–response of SNU449, 1BR-hTERT, HepG2 and SKOV3, and upon 37-mer peptide treatment. Cell response of each specific cell type was normalized to a scale running from 0 to 100. A Peptide treatment response of SNU449. IC50 value was calculated as 76.4 ± 0.6015 μM (R2 = 0.8410) from 24 h treatment, and 88.4 ± 0.9148 μM (R2 = 0.8969), from 48 h exposure, respectively. B Cisplatin exposure of SNU449 at 48 h produced a response curve from which the IC50 value was calculated as 12.79 ± 2.055 μM (R2 = 0.7716). C 1BR-hTERT 24 h dose–response curve generated an IC50 of 90.5 ± 0.521 μM (R2 = 0.9481). D HepG2 peptide 24 h treatment response curve produced an IC50 of 33.65 ± 1.09 μM (R2 = 0.8528). E SKOV3 response from 24 h peptide treatment produced an IC50 value of 27.45 ± 1.5085 μM (R2 = 0.8404)

