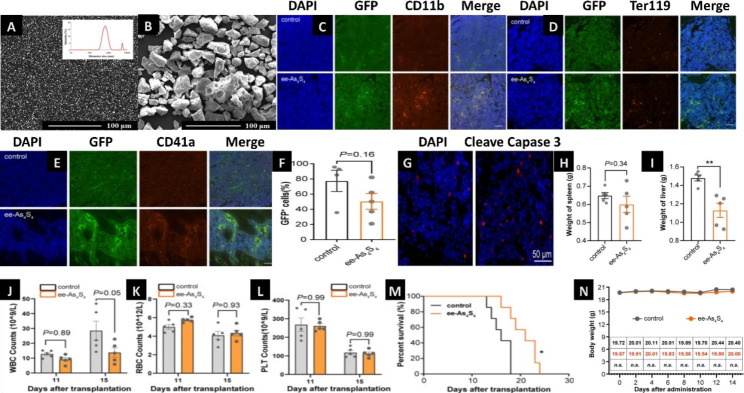
Fig. 3.
Nanocrystal delivery system of AML treatment Note: SEM images of realgar particles in e-As4S4 (A) and r-As4S4 (B). (Figure source from the reference [41], color figure can be viewed at nature.com). (C-E) Immunofluorescence staining images of three markers (CD11b, Ter 119 and CD41a) in femurs of mice after treated with ee-As4S4. Scale bar indicates 100 μm. (F) The percentage of GFP+ leukemia cells in the bone marrow determined by flow cytometry. (G) Immunofluorescence staining of cleaved caspase-3 in the femur of mice from control and ee-As4S4 group. (H and I) The spleen and liver weight of AML mice (n = 5). (J–L)The counts of white blood cell (WBC), red blood cell (RBC), and platelet (PLT)(n = 5). (M) Survival curve of AML mice (n = 7). *P < 0.05,**P < 0.01. (N) The body weight in vivo safety of ee-As4S4 in mice(n = 6).(Figure source from the reference [42], color figure can be viewed at dove press.com)

