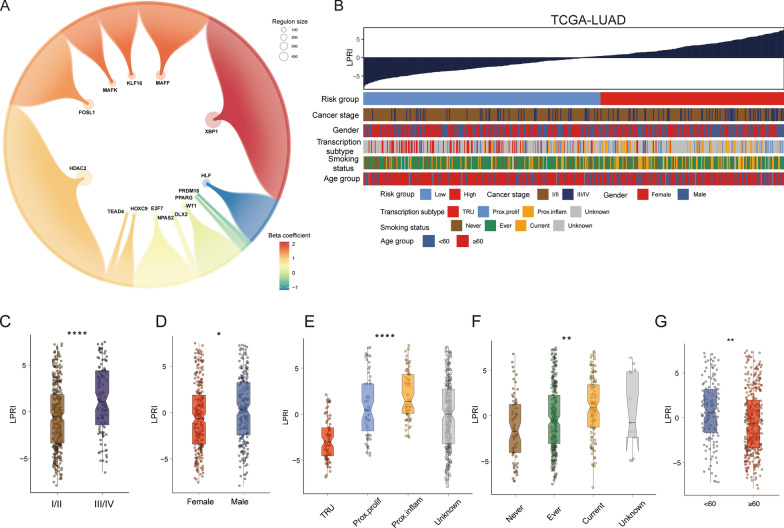
Fig. 2.
Development of LPRI and clinical features associated with LPRI. A Identification of prognostic regulons. Large bubbles represent the TFs. Small bubbles represent the targets. Bubble size is proportional to the number of target genes. Colors represent the beta coefficient for each regulon from the univariate COX regression analysis. B The clinical and molecular features associated with the LPRI in the TCGA-LUAD dataset. C–G Box plots of LPRI in individual samples, stratified by stage, gender, TCGA subtype, KPS, smoking status, and age. ‘ns’ means no statistical significance, ∗P < 0.05, ∗∗P < 0.01, ∗∗∗P < 0.001 and ∗∗∗∗P < 0.0001

