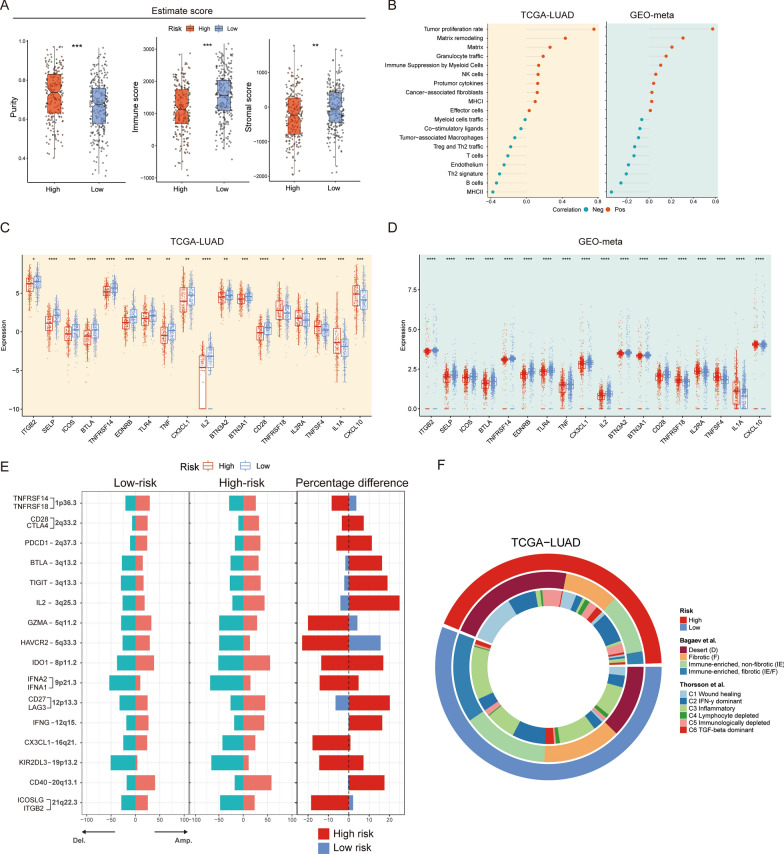
Fig. 6.
Characterization of immunogenomic features in LPRI subgroups. A Comparisons of the Purity, ImmuneScores, and StromalScores from the ESTIMATE software between low- and high-risk subgroups. B Pearson’s correlation between LPRI and TME signatures in the TCGA-LUAD and GEO-meta dataset. C, D Differences in immune genes between and GEO-meta dataset. E Altered CNV between low- and high-risk subgroups in the TCGA-LUAD in immunogenomics. F Comparison of risk subgroups in the current study with immune subtypes from previous studies. ‘ns’ means no statistical significance, ∗P < 0.05, ∗∗P < 0.01, ∗∗∗P < 0.001 and ∗∗∗∗P < 0.0001

